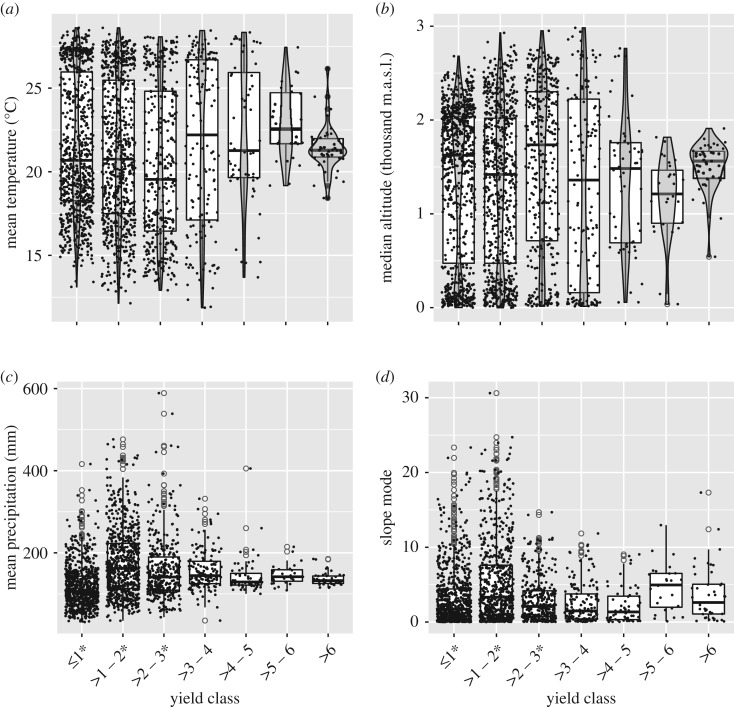
Figure 2.
Box plots of the distribution of municipalities planted to rainfed maize in 2010 grouped by yield class for four environmental variables: (a) mean temperature during rainy season (May–Oct), (b) median altitude, (c) mean precipitation during rainy season and (d) slope mode. For (a,b), violin plots are shown on the top of boxplots, showing that for levels 1–3, the data have a bimodal distribution. *Yield classes mostly representing campesino agriculture (see electronic supplementary material, table S6 for equality of coefficients of variation test results). (Online version in colour.)

