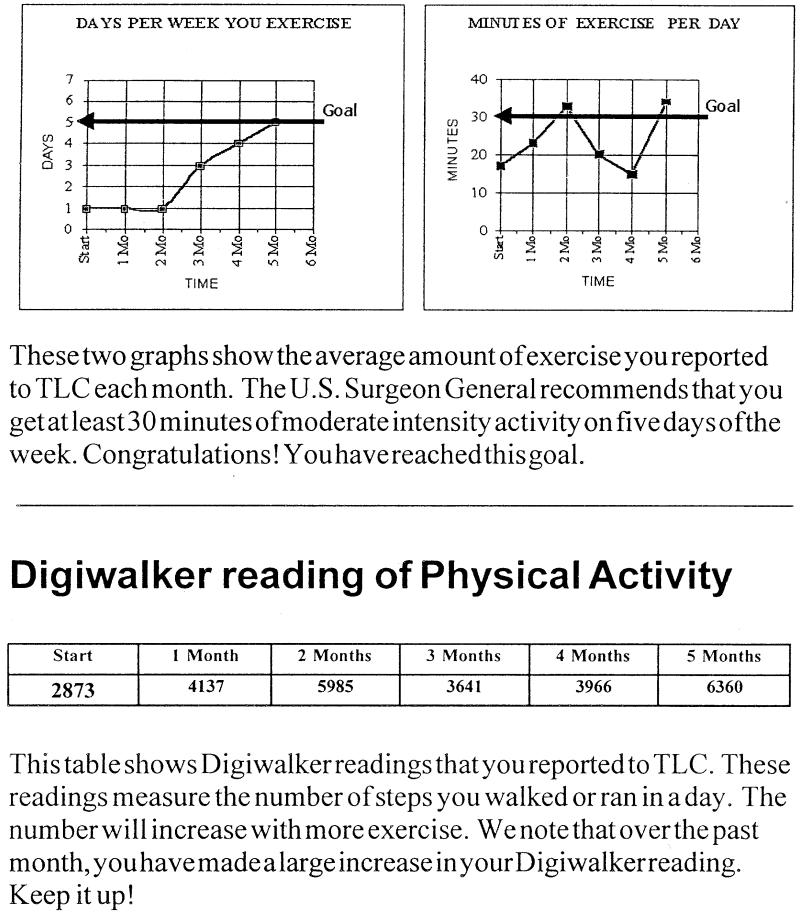
Figure 2.
Sample patient report for TLC-ACT. This is an example of a patient report for TLC-ACT, an application for promoting physical activity. The upper two graphs display the patient's average level of physical activity per month. The graph on the left plots the average number of days per week that the patient was active. The graph on the right depicts the average number of minutes of activity per active day. The graph at the bottom of the page displays the average pedometer readings reported by the patient.

