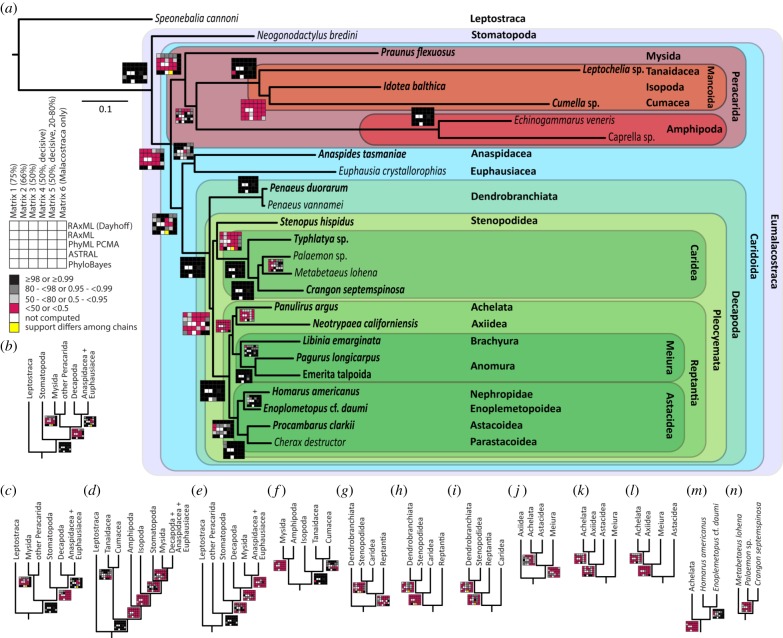
Figure 2.
Phylogenetic relationships within Malacostraca. (a) Topology based on the PhyloBayes CAT-GTR analysis of the malacostracan-specific matrix 6. Support values for all analyses are depicted as rug plots. Nodes supported in only one of two PhyloBayes chains are marked in yellow (the two PhyloBayes chains did not converge for these nodes). Individuals newly sequenced for this study are highlighted in bold. All alternative topologies with support greater than 50 or 0.5 in any analysis are shown: (b–e) position of Stomatopoda and Mysida, (f) relationships within Peracarida, (g–i) Decapoda, (j–m) Reptantia and Astacidea and (n) Caridea. (Online version in colour.)

