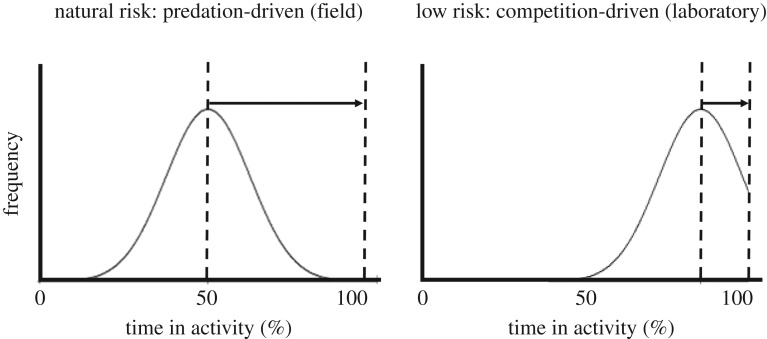
Figure 3.
The distribution of expressions of a trait (here, activity) in two populations from environments with different levels of predation risk. (a) Population collected from the field (high predation); (b) laboratory-bred population (low predation). Black arrows illustrate the potential for contaminant-induced increases in activity in the populations (the longer the arrow, the greater the potential change).

