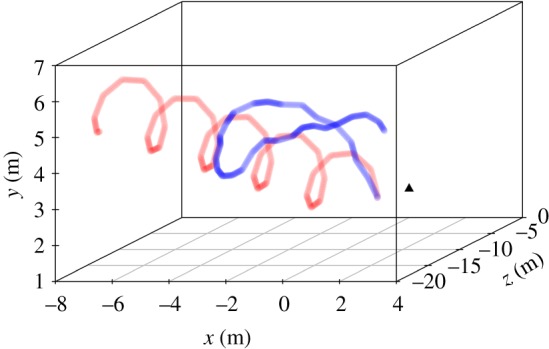
Figure 1.

Representative movement paths from a prey with all fixed movement parameters (red; which has a path complexity of 1.53) and a prey with all protean movement parameters (blue; which has a path complexity of 2.29). The black triangle denotes the location of the participant's head in each case, and all prey start from the same position.
