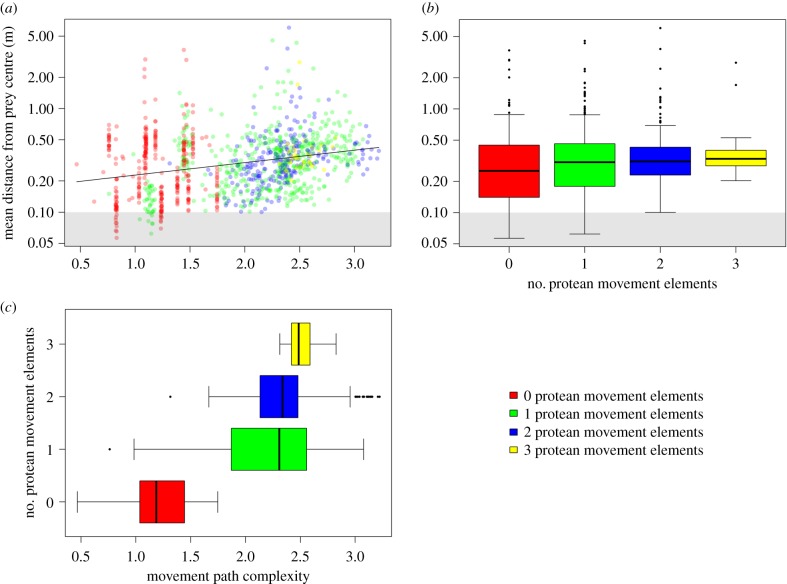
Figure 2.
(a) Targeting accuracy (measured as the mean distance from the centre of the prey item over the course of a trial) as a function of movement path complexity. Higher values along the x-axis denote more complex movement paths, while higher values along the y-axis denote poorer targeting accuracy. Note the log scale on the y-axis. Each data point represents a single simulated prey item, and is coloured according to how many protean movement elements it had. The solid line denotes the glmm model fit, and the grey shaded area indicates distances within the ‘body’ of the prey item. For any data point within this shaded area, participants therefore managed to maintain the targeting reticle over the prey's body throughout the entire trial, on average. (b) Movement path complexity as a function of the number of protean movement elements, and (c) targeting accuracy as a function of the number of protean movement elements. Thick lines denote the median, boxes the interquartile range, lines the range of the data, and dots denote potential outliers.

