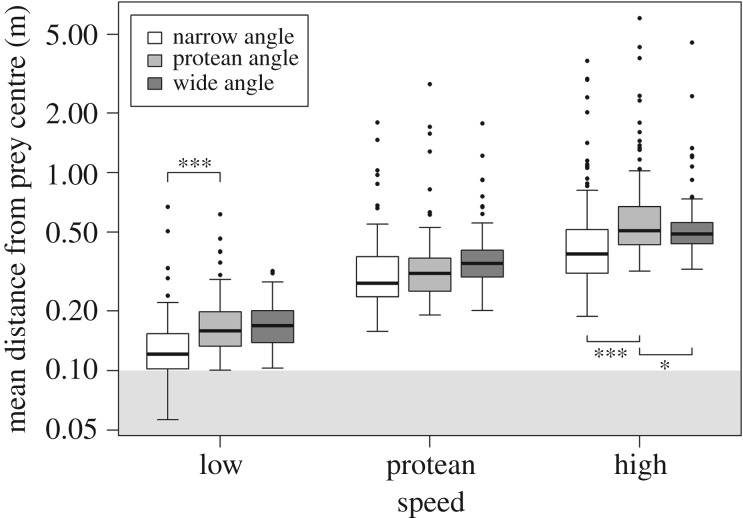
Figure 3.
Targeting accuracy (measured as the mean distance from the centre of the prey item over the course of a trial) as a function of speed (which was categorized as low, protean or high) and angle (which could be either narrow, protean or wide); please see text for full details. Higher values along the y-axis denote poorer targeting accuracy (note the log scale). Thick lines denote the median, boxes the interquartile range, lines the range of the data, and dots denote potential outliers. The grey shaded area indicates distances within the ‘body’ of the prey item. Asterisks (*) denote significant differences between levels of angle at each given level of speed: *p < 0.05; ***p < 0.001.

