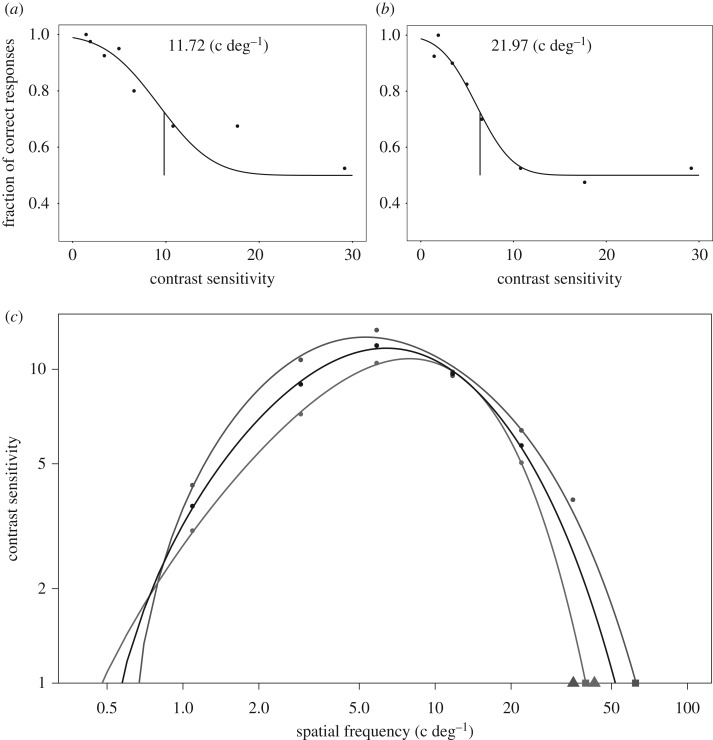
Figure 1.
The behavioural contrast sensitivity function of Harris's hawks. (a,b) Examples of two psychometric functions from contrast threshold tests of (a) Harris's hawk A and (b) Harris's hawk B with different spatial frequencies. Each circle represents 40 choices made by one bird. Vertical lines are threshold values interpolated from logistic functions that were fitted to the data. All curves are given in the electronic supplementary material, figure S2. (c) Contrast sensitivity, defined as the inverse of contrast threshold, as a function of spatial frequency. Sensitivity values were fitted to a double exponential function (see methods). Red, Harris's hawk A; blue, Harris's hawk B; black, the pooled data. Filled squares at the baseline represent the spatial resolution threshold extrapolated from the contrast sensitivity function. Triangles represent the spatial resolution threshold of the same two individuals determined in the study of Potier et al. [19]. (Online version in colour.)

