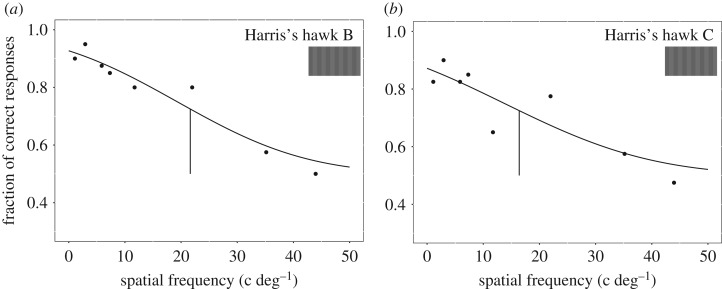
Figure 2.
Psychometric functions used to determine the chromatic spatial resolution of (a) Harris's hawk B and (b) Harris's hawk C. Each circle represents 40 choices made by one bird. Vertical segments are threshold values, which were interpolated from logistic functions that were fitted to the data. (Online version in colour.)

