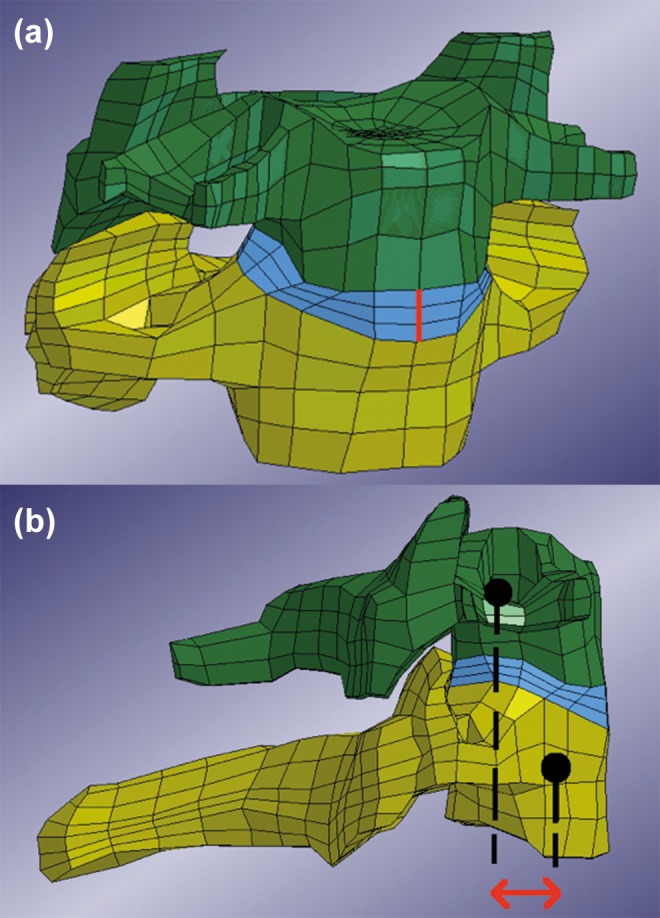
Figure 7.

(a) Anterior view of the C6 and C7 vertebrae with disc and the original gap distance marked with thick (red) line. Note that the line represents a gap distance that was set to zero in the results. (b) Lateral view of C6 and C7 vertebra. Arrow (red) indicates measured horizontal translation. Dots should be considered to be in the center of the vertebrae respectively.
