. 2018 Jun 12;8(6):652–654. doi: 10.1177/2192568218782679
© The Author(s) 2018
This article is distributed under the terms of the Creative Commons Attribution-NonCommercial-NoDerivs 4.0 License (http://www.creativecommons.org/licenses/by-nc-nd/4.0/) which permits non-commercial use, reproduction and distribution of the work as published without adaptation or alteration, without further permission provided the original work is attributed as specified on the SAGE and Open Access pages (https://us.sagepub.com/en-us/nam/open-access-at-sage).
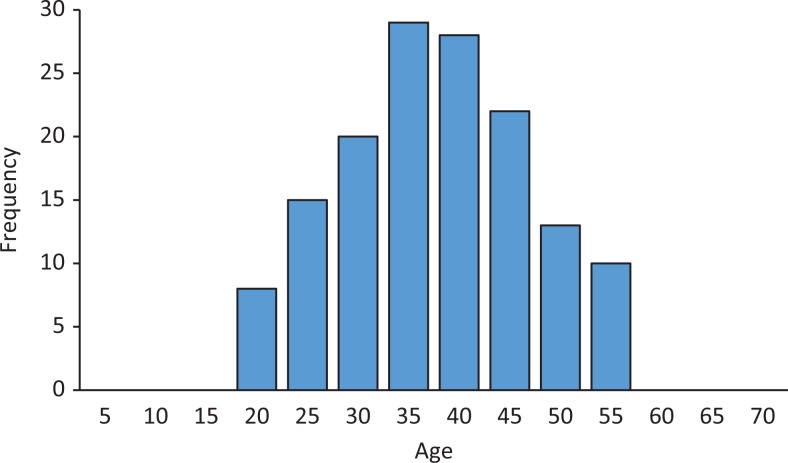
Figure 2.
Mean age similar to Figure 1 but with a tighter distribution.

