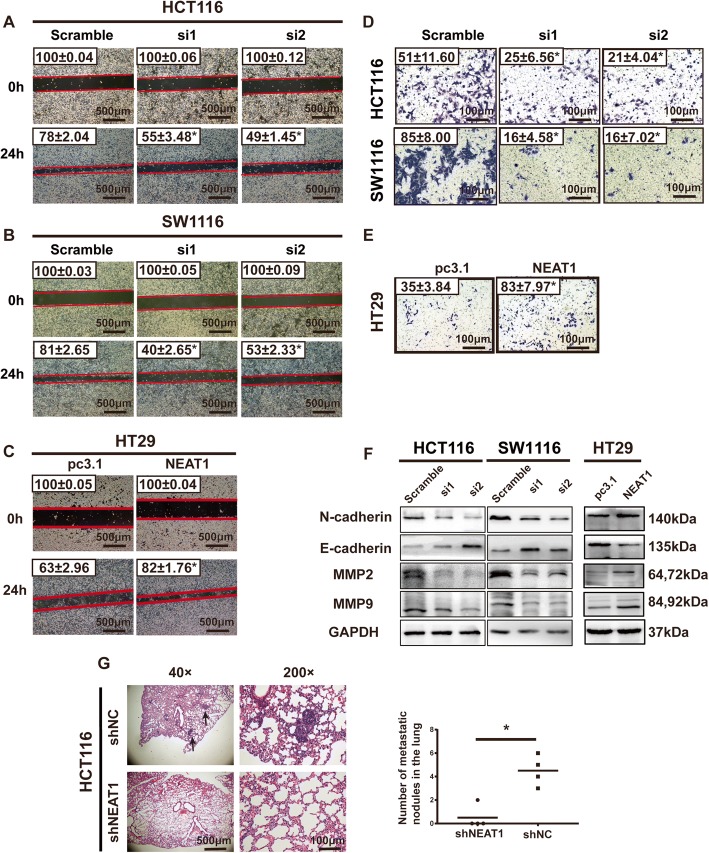
Fig. 3.
Repression of NEAT1-inhibited cell invasion and migration in vitro and in vivo. Representative images (× 40) of wound healing assays in HCT116 (a), SW1116 (b), and HT29 (c) cells (*p < 0.05). d Representative images (× 200) of Transwell invasion assays for the indicated cells (*p < 0.05). e Representative images of Transwell invasion assays for HT29 cells. f Western blotting results for N-cadherin, E-cadherin, MMP2, and MMP9. g Representative images of lung metastasis in nude mice with HE staining

