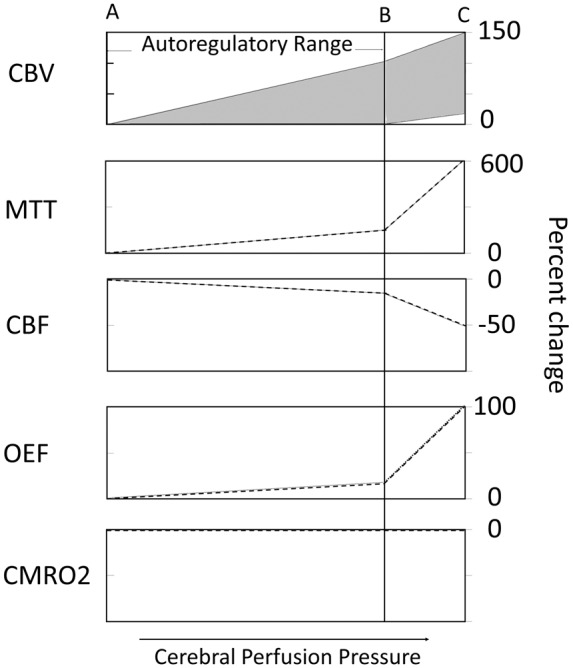
Figure 1.

Oligemia – modified schematic of hemodynamic and metabolic responses to reductions in cerebral perfusion pressure after Derdeyn et al.11 The x-axis represents progressive reduction in perfusion pressure through the oligemic range (not true ischemia). The region between points A and B is the autoregulatory range. The region between points B and C is the region of autoregulatory failure where cerebral blood flow (CBF) falls passively as a function of pressure. Point C represents the exhaustion of compensatory mechanisms to maintain normal oxygen metabolism and the onset of true ischemia. CBV: Cerebral blood volume either remains unchanged or increases with autoregulatory vasodilation (crosshatched area), depending largely on the methods used to measure CBV. With autoregulatory failure, most investigators have found further increases in CBV. CBF: Cerebral blood flow falls slightly through the autoregulatory range. Once autoregulatory capacity is exceeded, CBF falls passively as a function of pressure down to 50% of baseline values. OEF: Oxygen extraction fraction (OEF) increases slightly with the reductions in CBF through the autoregulatory range. After autoregulatory capacity is exceeded and flow falls up to 50% of baseline, OEF may increase up to 100% from baseline. CMRO2: The cerebral metabolic rate for oxygen consumption remains unchanged throughout this range of CPP reduction owing to both autoregulatory vasodilation and increased OEF.
