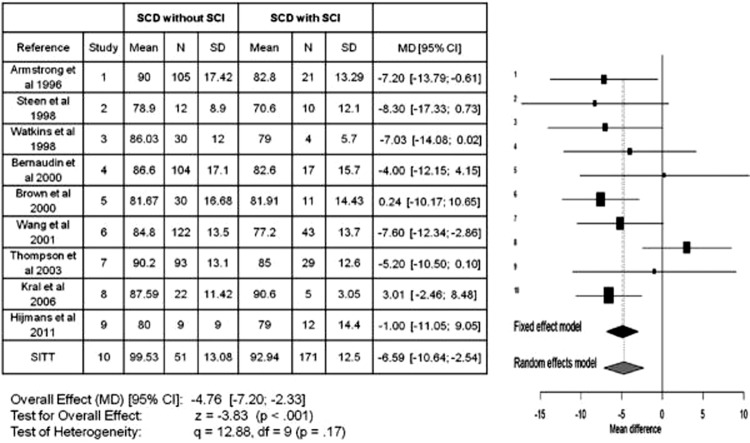
Figure 2.
Meta-analysis of studies in children with sickle cell anemia that included full scale intelligence quotient (FSIQ) for those with and without silent cerebral infarcts (silent strokes). The meta-analysis includes a total of 10 published studies and compares the mean difference in FSIQ between those children with sickle cell anemia with and without a silent stroke. The Forrest plot x-axis reflects the mean FSIQ difference between those with and without silent stroke. The horizontal lines represent the upper and lower boundaries of the 95% confidence interval. If the 95% confidence interval overlaps zero or crosses the zero threshold, then no statistical differences were observed in that study. The black and gray diamonds represent the results of the fixed and random effect models. The edges of the diamonds represent the 95% confidence interval of the meta-analyses for the fixed and random effect models.12 The Forrest plot graphically shows the study size, the effect size, and the direction of change in the FSIQ. The figure summarizes the strong evidence that silent strokes lead to a reduction in FSIQ in children with SCA. Used with permission.

