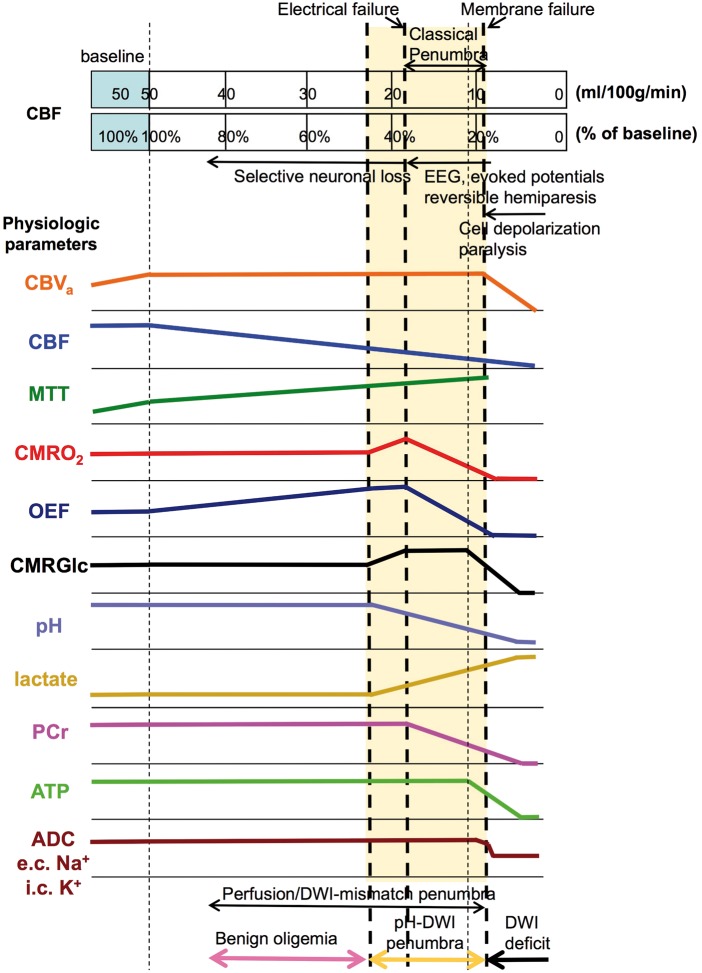
Figure 1.
Relationships between CBF thresholds (human) and neurological, hemodynamic, metabolic, and cellular parameter changes. Thresholds are approximate, assuming PET-based normal gray matter CBF of about 50 ml/100 g/min, and may shift to higher CBF with longer ischemic duration. Curve can be adjusted proportionally for baseline CBF from other methods, such as MRI and CT. Curve heights are relative to baseline on the left. The blue extended area at constant CBF of 50 ml/100 g/min is needed to depict the area of autoregulation during initial vessel blockage and reduction in cerebral perfusion pressure where CBV increases and flow remains constant. Metabolic penumbra in yellow shade. At the bottom, zones of perfusion-DWI and pH-DWI mismatch are shown, with the difference being benign oligemia. Color coding for these zones will be used in Figure 3.
e.c: extracellular; i.c: intracellular.

