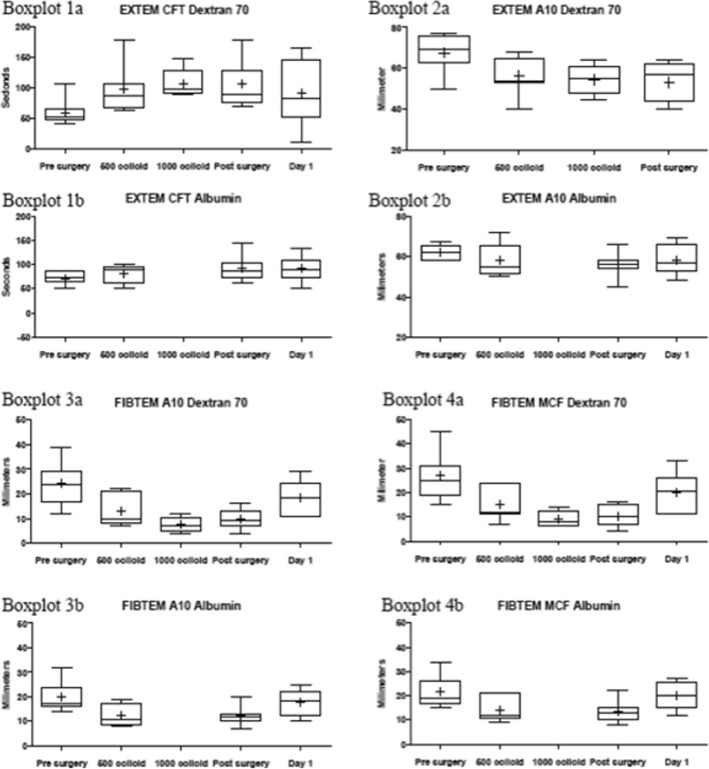
Fig. 1.
Sample figure describing the different ROTEM values. Boxplot 1 a + b: Change of EXTEM CFT values over time for dextran and albumin. Albumin 1000 colloid omitted due to limited data (n = 2). Boxplot 2 a + b: Change of EXTEM A10 values changes over time for dextran and albumin. Albumin 1000 colloid omitted due to limited data (n = 2). Boxplot 3 a + b: Change of FIBTEM A10 values over time for dextran and albumin. Albumin 1000 colloid omitted due to limited data (n = 2). Boxplot 4 a + b: Change in FIBTEM MCF values over time for dextran and albumin. Albumin 1000 colloid omitted due to limited data (n = 2)

