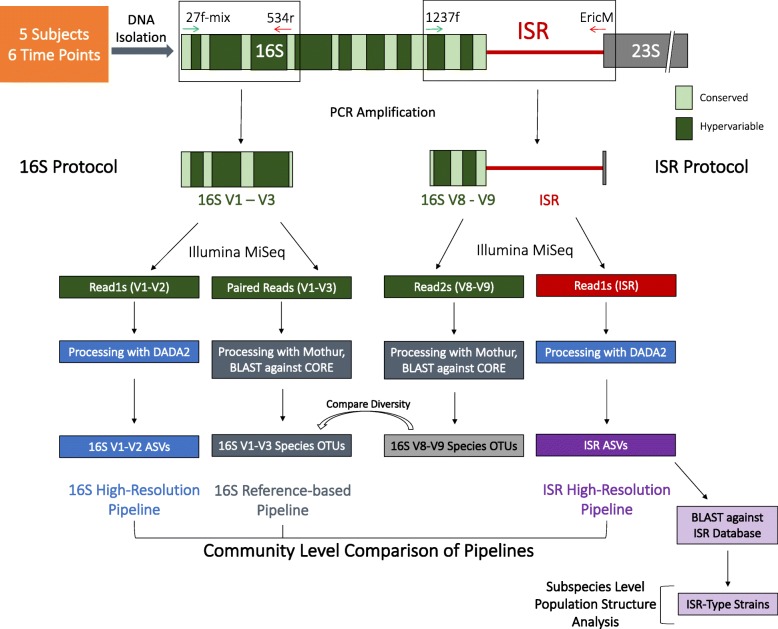
Fig. 2.
Schematic of the PCR amplification, sequencing, and bioinformatic processing pipeline for this study. The 16S V1-V3 and 16S V8-V9-ISR regions were amplified separately, with validated universal primers. Amplicons were sequenced using Illumina MiSeq with 2x300 bp paired-end chemistry. Sequence reads were processed in three different bioinformatic pipelines as shown, and community composition was compared to evaluate performance of each pipeline. The ISR reads were also used for subspecies level population structure analysis

