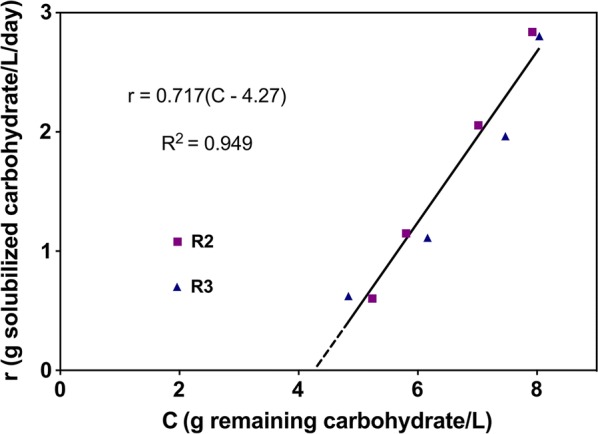
Fig. 3.

Rate of total carbohydrate solubilization r (g solubilized carbohydrate/L/day) vs. concentration of unutilized carbohydrate C (g remaining carbohydrate/L). Mean of steady-state solubilization data of each residence time (RT) of R2 and R3 (shown in Additional file 4: Table S3) was used to calculate C and r. Linear regression was performed and fitting curve was shown as solid black line in the figure
