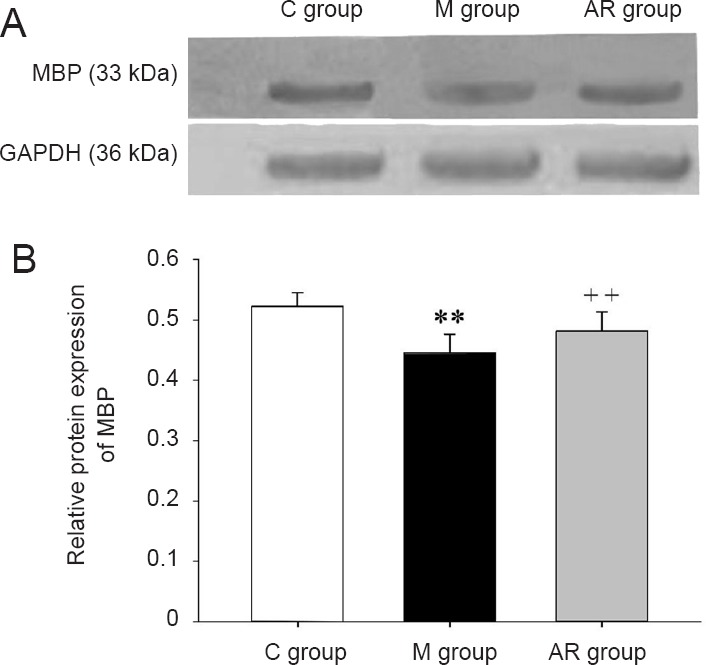
Figure 7.

MBP levels in the hippocampus (western blot assay).
(A) Protein bands of MBP and GAPDH in the hippocampus of each group. (B) The levels of MBP in the hippocampus of each group. Data are presented as the mean ± SD (n = 8). Comparisons between groups were conducted by a one-way analysis of variance followed by the least significant difference post hoc test. **P < 0.01, vs. C group; ++P < 0.01, vs. M group. C group: Control group; M group: model group; AR group: AOAA remedy group (chronic alcoholism model + aminooxyacetic acid remedy); MBP: myelin basic protein. AOAA: Aminooxyacetic acid.
