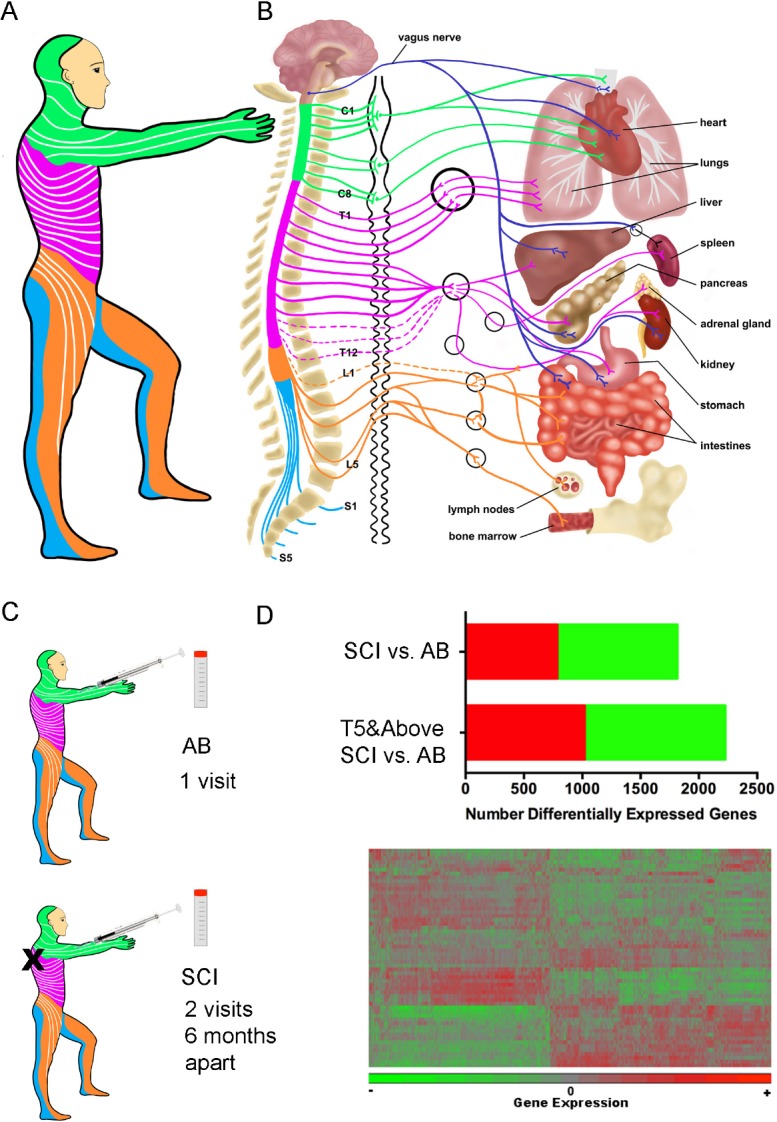
Figure 1.

Neuroimmune interactions relevant to spinal cord injury (SCI).
(A) Sensory dermatomes that are innervated at each spinal level are indicated by color, which matches the color scheme in B. (B) Schematic representation of the brain and spinal cord that demonstrates spinal levels contributing autonomic nervous system (ANS) innervation to visceral organs and immune system tissues. Dark blue lines show nerve fibers carrying parasympathetic nervous system (PNS) innervation via the vagus nerve. Other lines show nerve fibers carrying sympathetic nervous system (SNS) innervation to target organs following synapses at the sympathetic trunk, shown in black immediately to the right of the spinal column. Color Key: Green: Cervical, pink: thoracic, orange: lumbar, blue: sacral. (C) Able-bodied (AB) individuals or individuals with chronic SCI were recruited for this study and blood collected for whole blood gene expression. (D) There were 1815 and 2226 differentially expressed genes between the AB and SCI groups and the AB and T5 and above SCI group (upper). A cartoon of a heat map is shown for differentially expressed genes that were then analyzed at the individual, pathway and modular levels (lower).
