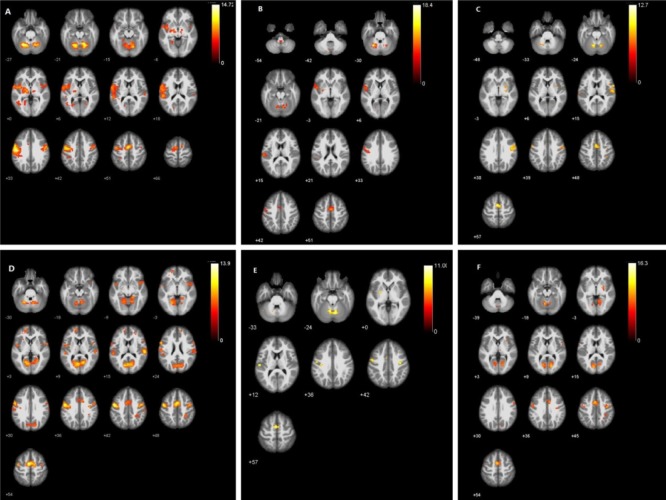
Figure 2.
Activation maps of brain regions in healthy subjects and peripheral facial nerve palsy patients during facial movements.
(A) Activated brain regions in the control group during smiling. (B) Activated brain regions in the patient group on the affected side during smiling. (C) Activated brain regions in the patient group on the unaffected side during smiling. (D) Activated brain regions in the control group during blinking. (E) Activated brain regions in the patient group on the affected side during blinking. (F) Activated brain regions in the patient group on the unaffected side during blinking. The warm color bar is used to define the activation of the voxels. Red-yellow suggests a positive activation in the brain area. The numbers in the figures correspond to the slice numbers in the CH2 brain template. Control group: Healthy subjects; patient group: peripheral facial nerve palsy patients with unilateral synkinesis.

