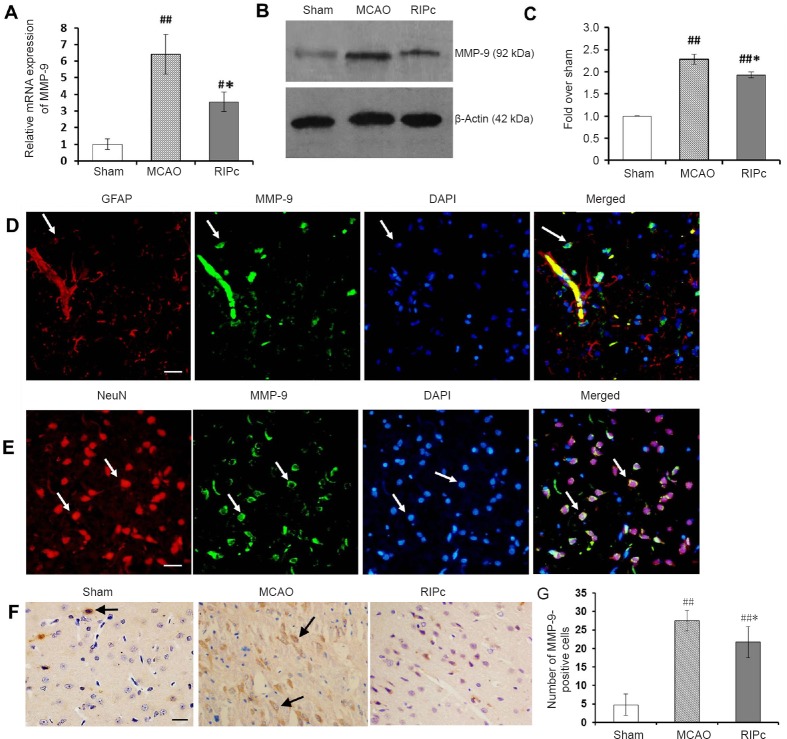
Figure 2.
Effect of limb RIPc on transcription and expression of MMP-9 in ischemic brain.
(A) Relative expression of MMP-9 mRNA (real-time quantitative reverse transcription-polymerase chain reaction). Results are expressed as fold change over the sham group. (B) Representative western blot images of MMP-9 protein in ischemic brain of different groups. (C) Protein expression levels of MMP-9. (D) Double immunofluorescence images of MMP-9 and GFAP in the MCAO group. Nuclei were labeled with DAPI (blue). MMP-9-positive cells were labeled green by Alexa Fluor 488, while GFAP-positive cells were labeled red by Alexa Fluor 594. White arrows indicate corresponding positive cells or co-localization of MMP-9 and GFAP. Scale bar: 20 μm. (E) Double immunofluorescence images of MMP-9 and NeuN in the MCAO group. Nuclei were labeled with DAPI (blue). MMP-9-positive cells were labeled green by Alexa Fluor 488, while NeuN-positive cells were labeled red by Alexa Fluor 594. White arrows indicate corresponding positive cells or co-localization of MMP-9 and NeuN. Scale bar: 20 μm. (F) Immunohistochemistry images of MMP-9. Black arrows indicate MMP-9-positive cells. Scale bar: 20 μm. (G) Number of MMP-9-positive cells around the infarct area. (A, C, G) Data are expressed as the mean ± SEM (one-way analysis of variance followed by Student’s t-test and post hoc Fisher’s tests). *P < 0.05, vs. MCAO group; #P < 0.05, ##P < 0.01, vs. sham group. The experiment was performed five times. RIPc: Remote ischemic postconditioning; MCAO: middle cerebral artery occlusion; MMP-9: matrix metalloproteinase-9; GFAP: glial fibrillary acidic protein.

