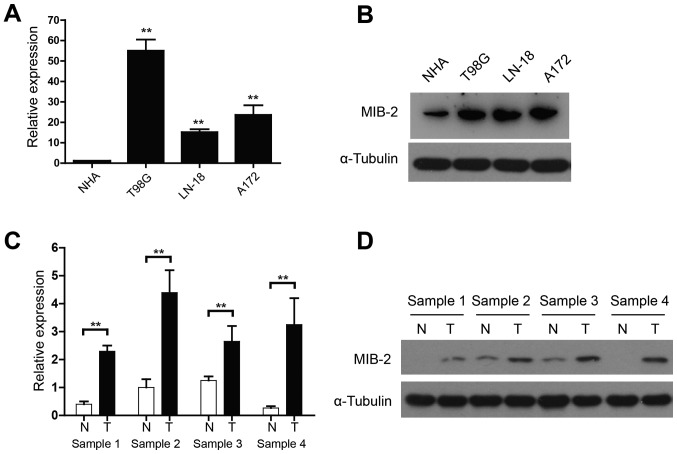
Figure 1.
Expression of MIB2 is elevated in human glioma cell lines and clinical glioma specimens. (A) RT-qPCR analysis of MIB2 mRNA in NHA and glioma T98G, LN-18 and A172 cell lines. Data are normalized to GAPDH and are presented as the mean ± standard deviation of 3 independent experiments. **P<0.01 by one-way ANOVA and Tukey's post hoc test. (B) Expression of MIB2 protein in NHA and indicated glioma cell lines. α-Tubulin was used as the loading control. (C) Reverse transcription-quantitative polymerase chain reaction analysis of MIB2 mRNA in four pairs of primary glioma tissues. Data are normalized to GAPDH and are presented as the mean ± SEM of three experiments, with statistical significance determined by one-way ANOVA and Tukey's post hoc test. **P<0.01. (D) Expression of MIB2 protein in paired T and N samples by western blot analysis. α-Tubulin was used as the loading control. NHA, normal human astrocyte; MIB2, E3 ubiquitin-protein ligase; ANOVA, analysis of variance; T, primary glioma samples; N, adjacent non-cancerous brain tissues.

