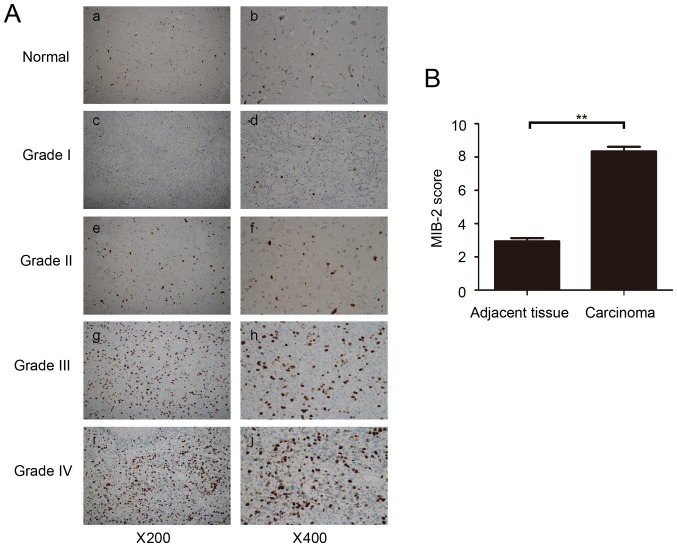
Figure 2.
Immunohistochemical analysis of MIB2 expression in normal brain tissues and primary glioma tumors. (A) Representative images from IHC assays of normal brain tissues and specimens of 69 archived glioma cases. (a,b) Normal brain tissue; (c,d) WHO grade 1 pilocytic astrocytoma; (e,f) WHO grade 2 diffuse astrocytoma; (g,h) WHO grade 3 anaplastic astrocytoma; (i,j) WHO grade 4 glioblastoma multiforme. (a,c,e,g,i) Magnification, ×200. (b,d,f,h and j) Magnification, ×400. (B) Comparative statistical quantification of the mean values of MIB2 staining between normal brain tissues (n=3) and glioma specimens of different WHO grades. Student's t-test was used for statistical analysis. **P<0.01. IHC, immunohistochemistry; MIB2, E3 ubiquitin-protein ligase; WHO, World Health Organization.

