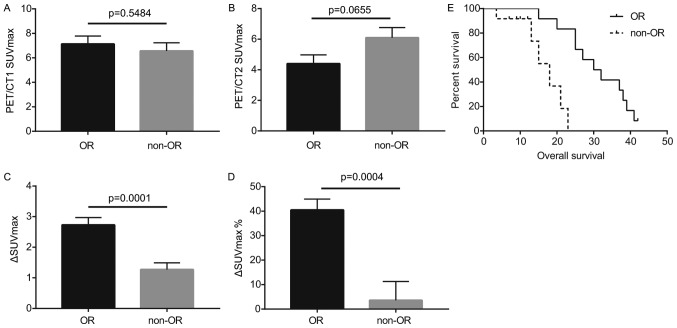
Figure 1.
Comparisons of the PET/CT1 SUVmax, PET/CT2 SUVmax, ΔSUVmax, ΔSUVmax%, and OS between OR and non-OR groups. (A) Comparison of PET/CT1 SUVmax between OR and non-OR groups. (B) Comparison of PET/CT2 SUVmax between OR and non-OR groups. (C) Comparison of ΔSUVmax between OR and non-OR groups. (D) Comparison of ΔSUVmax% between OR and non-OR groups. Comparisons shown by lines. (E) Comparison of OS between OR and non-OR groups. PET/CT1, positron emission tomography-computed tomography prior to chemotherapy; PET/CT2, positron emission tomography-computed tomography following chemotherapy; SUVmax, maximal standardized uptake value; ΔSUVmax, change in standardized uptake value; OR, objective remission; OS, overall survival.

