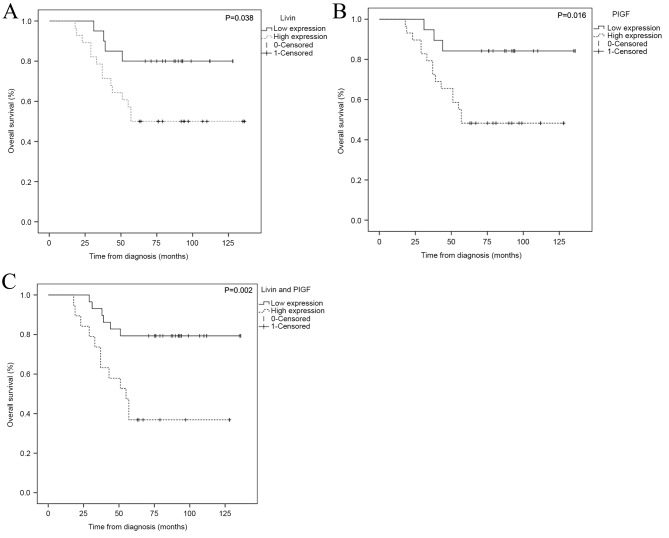
Figure 3.
Kaplan-Meier estimator survival curves for patients with osteosarcoma according to the expression of Livin and PIGF. (A) Livin high expression predicted a decreased overall survival (P=0.038). (B) PIGF high expression predicted a decreased overall survival (P=0.016). (C) High expression of Livin and PIGF predicted a decreased overall survival (P=0.002). The dashed line represents positive expression of Livin or/and PlGF, while the solid line represents negative expression of Livin or/and PlGF. Livin, baculoviral IAP repeat containing 7; PIGF, placental growth factor.

