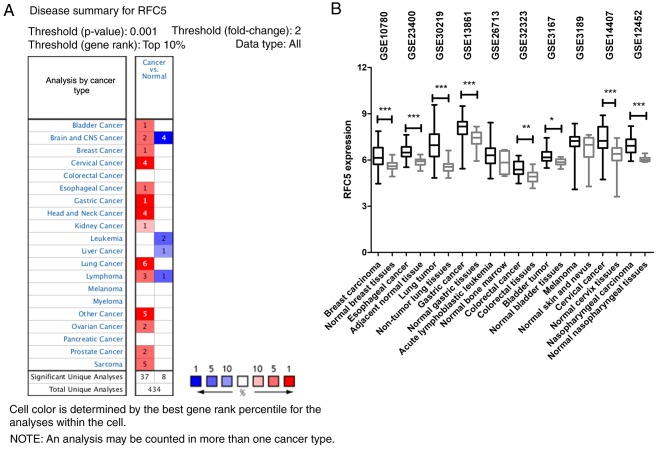
Figure 1.
Analysis of RFC5 expression in various types of human cancer. (A) The ONCOMINE database was queried for RFC5 expression between cancer and normal specimens by using the criteria: Two-fold change for RFC5 expression, top 10% gene rank and P-value<0.001. Red, RFC5 upregulation; blue, RFC5 downregulation. (B) RFC5 expression was visualized by using 10 publicly available Gene Expression Omnibus datasets. RFC5 expression was transformed into log2 (probe intensities) and presented as the mean ± standard error. *P<0.05; **P<0.01; ***P<0.001. CNS, central nervous system; RFC5, replication factor C subunit 5.

