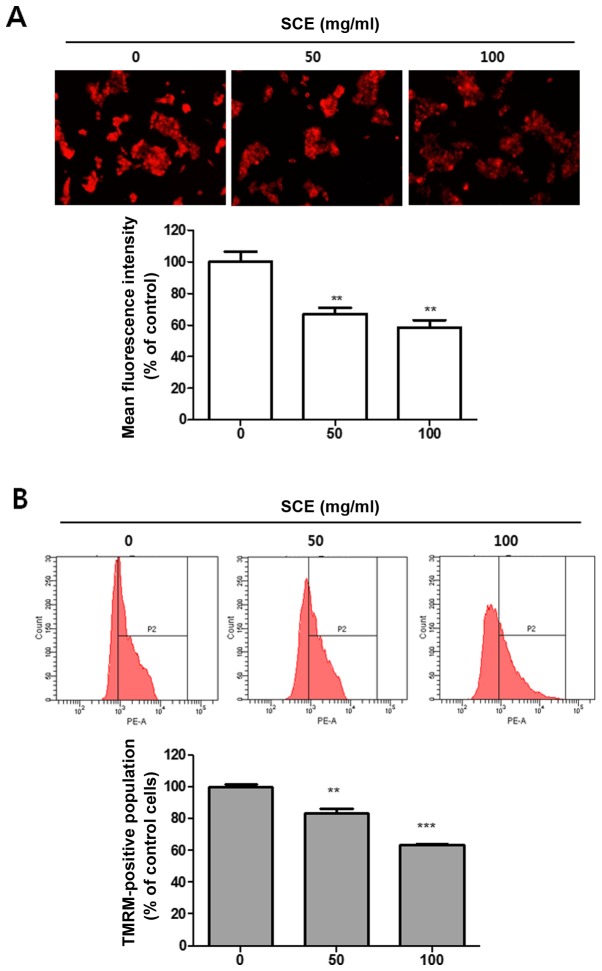
Figure 3.
SCE reduces mitochondrial membrane stability. HCT116 cells were treated with the indicated concentrations of SCE for 24 h and then stained with TMRM for the detection of membrane stability. (A) Representative images of TMRM-stained mitochondria were captured by fluorescence microscopy (magnification, ×200) and mean fluorescence intensities (presented as the mean ± SEM) were calculated as a percentage of the control (0 mg/ml SCE). **P<0.01 compared with the control. (B) The TMRM-stained cells were analyzed by flow cytometry with excitation/emission wavelengths at 488/560 nm (indicated with PE-A). The population of TMRM-positive HCT116 cells (P2) was analyzed by FACS analysis. Representative FACS results are shown as the mean ± SEM. **P<0.01 and ***P<0.001 compared with control. TMRM, tetramethylrhodamine methyl ester perchlorate; SCE, Sorbus commixta water extract; SEM, standard error of mean; FACS, fluorescence-activated cell sorting.

