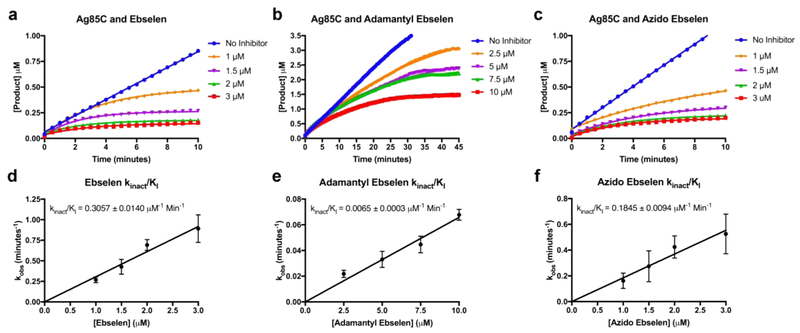
Figure 3.
kinact/KI determination: (a−c) progress curves of the enzymatic reactions in the presence of specific inhibitor at specific concentrations as a function of increasing reaction product (resorufin, μM) over time (min). The average of the triplicate reads is plotted and fitted with a one-phase association equation. (d−f) Resulting kinact/KI plots for ebselen, adamantyl ebselen, and azido ebselen.

