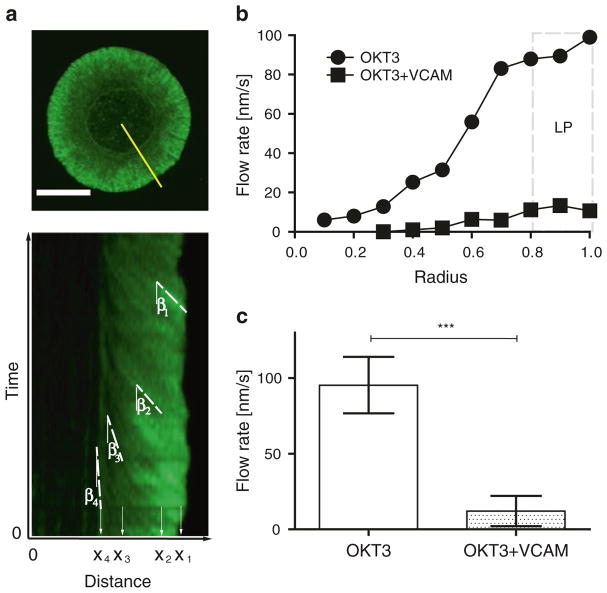
Fig. 1.
Characterization of F-actin dynamics in Jurkat T lymphoma cells. T cells were allowed to interact with coverslips coated with anti-CD3 (OKT3) ± VCAM-1 and imaged for 4 min. (a) Single time point of a responding cell stimulated on anti-CD3 (top) and the corresponding kymograph of F-actin dynamics generated along the yellow line (bottom). The dotted lines trace the paths taken by distinct features along the distance xn with their corresponding angles βn. (b) Kymographic analysis of F-actin flow in Jurkat T cells, showing the distribution of F-actin velocity across the immunological synapse. The area marked by the dashed box displays the peripheral lamellipodial region (LP). (c) Actin flow rates within the LP region for Jurkat T cells responding to OKT3 in the absence or presence of VCAM-1. Means ± SD are shown (n = 20–40 cells per condition), ***, P < 0.001. Scale bar 10 μm

