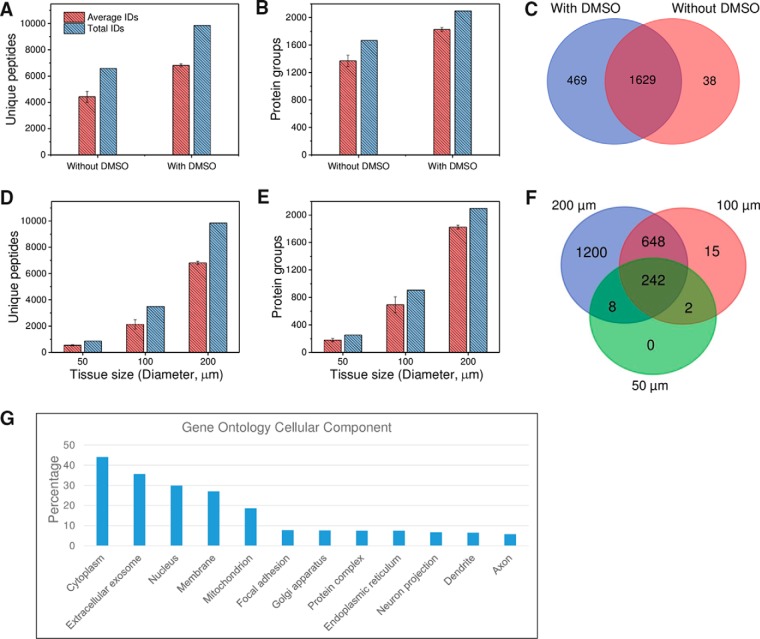
Fig. 3.
A–C, unique peptide (A) and protein (B) identifications for rat brain cortex tissue samples obtained by LCM followed by DMSO and DMSO-free sample collection. C, Venn diagram of total protein identifications. Tissue size: 200 μm in diameter and 12 μm in depth. D–F, Evaluation of the sensitivity of the LCM-nanoPOTS system in proteomic analysis of small rat cortex tissue samples. The relationship between tissue size and unique peptide (D) and protein (E) identifications, and (F) the overlap of total protein identifications in different sizes. G, Gene Ontology cellular component analysis of the 2098 proteins identified from 200-μm cortex tissues using the online tool DAVID (42). All peptide and protein identifications were based on MS/MS spectra with Match Between Runs disabled. Each condition was analyzed in triplicate.

