Abstract
Parkinson's disease (PD) is a neurological disorder characterized by the progressive loss of functional dopaminergic neurons in the nigrostriatal pathway in the brain. Although current treatments provide only symptomatic relief, gene therapy has the potential to slow or halt the degeneration of nigrostriatal dopamine neurons in PD patients. Adeno-associated viruses (AAV) are vectors of choice in gene therapy because of their well-characterized safety and efficacy profiles; however, although gene therapy has been successful in preclinical models of the disease, clinical trials in humans have failed to demonstrate efficacy. Significantly, all primary AAV receptors of the virus are glycans. We thus hypothesize that age related changes in glycan receptors of heparan sulfate (HS) proteoglycans (receptor for rAAV2), and/or N-glycans with terminal galactose (receptor for rAAV9) results in poor adeno-associated virus binding in either the striatum or substantia nigra, or both, affecting transduction and gene delivery. To test our hypothesis we analyzed the striatum and substantia nigra for changes in HS, N-glycans and proteomic signatures in young versus aged rat brain striatum and substantia nigra. We observed different brain region-specific HS disaccharide profiles in aged compared with young adult rats for brain region-specific profiles in striatum versus substantia nigra. We observed brain region- and age-specific N-glycan compositional profiles with respect to the terminal galactose units that serve as receptors for AAV9. We also observed brain region-specific changes in protein expression in the aging nigrostriatal pathway. These studies provide insight into age- and brain region-specific changes in glycan receptors and proteome that will inform design of improved viral vectors for Parkinson Disease (PD) gene therapy.
Keywords: Aging, Glycomics, Glycoproteomics, Parkinson's disease, Mass Spectrometry, Tandem Mass Spectrometry, Neurodegenerative diseases
Parkinson disease (PD)1, the second most common neurological disorder, is characterized by the lack of functional dopaminergic neurons in the nigrostriatal pathway, with age being the primary risk factor. Studies of non-human primates showed that cellular markers of aging mimic the histopathological features of PD. Aging-induced cellular mechanisms are accelerated in dopaminergic neuron degeneration in PD (1). Thus, understanding the role the aged environment plays in changes in the nigrostriatal pathway are critical to understanding dopaminergic neuron demise in PD.
Current treatment strategies for PD include replacement therapies for dopamine or drugs mimicking the action of dopamine, which provide temporary symptomatic relief (2). A major drawback of these therapeutic approaches is that they do not restore lost neurological function or protect from further degeneration of the nigrostriatal system. Gene therapy has the potential to provide neuroprotection and/or restoration. Currently, adeno-associated virus (AAV) vectors are being investigated in clinical trials to deliver trophic factors to the striatum of PD patients in order to provide neuroprotection for the remaining dopamine neurons (3).
AAVs are vectors of choice in gene delivery for PD because of their safety and efficacy profiles. Significantly, all primary receptors of the AAV are glycans (4–6). Preclinical aging models of rats have been successful in gene delivery, whereas in humans, clinical trials (7) have failed. A possible explanation is that age related changes in cells and ECM receptors for the viral delivery causes resistance to transduction of the virus (8, 9). Previous studies have demonstrated that transduction of the nigrostriatal system using AAV2, AAV5, or AAV9 is less efficient in aged rats than young adult rats (8, 10).
We sought to characterize the age-related changes in glycan and protein expression in the striatum and substantia nigra in young adult (3 months old) and aged (20 month old) rats. To do this, we applied glycosidase and protease enzymes in series to fresh-frozen striatum and substantia nigra tissue sections. The released products were extracted and analyzed using liquid chromatography-mass spectrometry.
MATERIALS AND METHODS
Experimental Design and Statistical Rationale
Aging studies were performed on six young (3 months) and six aged (20 months) male F344 rats. Three serial histological sections were used per brain region (striatum and substantia nigra) per animal as technical replicates. All serial tissue sections were process using the workflow described below. Additionally, bovine brain cortex tissue was used to control for reproducibility enzymatic activity and extraction of digestion products from the slides. All postextraction samples were spiked with an internal standard to control for run-to-run variability. Instrument performance was assessed daily with a quality control external standard.
Brain Cryosectioning
Rats were sacrificed with an overdose of pentobarbatol and perfused with cold saline (no heparin added). Brains were manually extracted and flash frozen in pre-chilled 2-methylbutane for 20 s. Brains were transferred to foil packets prechilled on dry ice and then stored at −80°C. Packets were transferred to −20°C the day of sectioning. Frozen tissue was sectioned using a cryostat. Brains were mounted on chucks using optimal cutting temperature (OCT) polymer to attach the cerebellum to the chuck (being very careful to avoid any OCT contact with brain regions rostral to the cerebellum). Brains were sectioned in the coronal plane at 10 μm thickness in the cryostat at approximately −12°C. Sections were adhered to Superfrost Plus slides. Slides were submerged for 1 min in acetone that was chilled for at least one hour in the cryostat at −12°C. The backs of the slides were dried and the striatum or substantia nigra in both hemispheres was outlined in permanent marker (images are shown in supplemental Figs. S1 and S2). Slides were placed back in the cryostat and then transferred to a pre-chilled slide box at −20°C for storage.
Enzymatic Digestion
Three fresh-frozen striatum and substantia nigra serial sections from each of six 3 month old rats Y1, Y2, Y3, Y4, Y5, Y6, and six 20 month old rats O7, O8, O9, O10, O11, O13 were chosen. Samples were randomized and blinded prior to digestion. Regions of striatum or substantia nigra were marked the back of the slides using a hydrophobic IHC Pap pen (SuperHT pen, Biotium) before serial ethanol (100%, 90%, 70%, 50%, 30%, water) washes. Equivalent areas from both brain hemispheres were digested and solutions pooled as single samples as described in supplemental Table S1. Hyaluronan digestion was performed using 5 sequential cycles of hyaluronidase (1.8 μl, 2 U/μl) incubation at 37°C for 1 h in a humidified chamber with the last cycle digested overnight, after which the digestion solutions were combined. After all the digestion cycles, the HA disaccharides were extracted sequentially using 5 additions of 1.8 μl 0.3% ammonium hydroxide, after which the extraction volumes were combined. Next, 5 sequential cycles of CS digestion was performed with chondroitinase ABC (1.8 μl, 2 mU/μl) at 37°C, for 1 h in a humidified chamber with the last cycle incubated overnight and extracted using 1.8 μl 0.3% ammonium hydroxide and combined. Following this, HS disaccharides and N-glycans were digested simultaneously using 5 sequential cycles of heparin lyases I, II, III (2 mU/μl) and PNGase F (500,000 U/ml) in a volume of 1.8 μl at 37°C, for 1 h in a humidifier chamber with the last cycle incubated overnight; released HS disaccharides and N-glycans were extracted following each cycle using 1.8 μl 0.3% ammonium hydroxide and combined. Following glycan extraction, samples were reduced and alkylated using 10 mm dithiothreitol (DTT) at 55 °C for 20 min and 20 mm iodoacetamide (IAA) in 25 mm ammonium bicarbonate incubated at 55 °C for 20 min for reduction and incubated at room temperature for 20 min in the dark for alkylation. Proteins were then digested using 5 cycles of trypsin (1.8 μl, trypsin 0.125 μg/μl) 37°C, for 1 h in a humidified chamber with the last cycle incubated overnight and extraction after digestion with 30% ACN in 0.1% TFA. The enzyme digestion conditions are summarized in supplemental Table S1. Glycan samples were desalted using size exclusion chromatography (GE Healthcare Life Sciences Superdex 3.2/300); HS disaccharide fractions were collected between 35–47 min and N-glycans were collected between 27–35 min using mobile phase (25 mm ammonium acetate, 5% acetonitrile) at a flowrate of 0.04 ml/min.
Heparan Sulfate Disaccharide Analysis
An internal standard of 400 fmol of a synthetic disaccharide (ΔUA-2S ® GlcNCOEt-6S (I-P) internal standard, HD009, Iduron) was added to all samples prior to HILIC-MS analysis. Randomized and blinded samples were analyzed using HILIC-MS with Thermo-Fisher Scientific Glycanpac AXH-1 stationary phase, 1.9 μm particle size packed in-house in a 150 μm X 20 cm column format. Disaccharides were fractionated using a gradient of 85 to 15% mobile phase B in 45 min, using mobile phase A 50 mm ammonium formate pH 4.5 and B 95% acetonitrile with a 55 min method using Waters nano-Acquity interfaced with LTQ-Orbitrap-XL(Thermo-Fisher Scientific) in negative polarity mode. The isoforms were quantified using targeted higher energy collisional dissociation (HCD) tandem mass spectrometry and relative and absolute disaccharide abundances are determined using standard curves as described previously (11, 12). Representative extracted ion chromatograms (EICs) are shown in supplemental Fig. S3.
N-Glycan Analysis
An internal standard of 400 fmol 2AB labeled N-glycan A2F (GKSB-313, Prozyme) was added to each sample prior to HILIC-MS analysis. Randomized and blinded samples were analyzed using HILIC-MS with Tosoh Biosciences, Amide-80, and 5 μm particle size stationary phase packed in-house in a 100 μm X 15 cm column format. Glycans were fractionated using a gradient of 80 to 20% mobile phase B in 40 min, using mobile phase A 50 mm ammonium formate pH 4.5 and B 95% acetonitrile compositions with a 70 min method using Waters nano-Acquity interfaced with LTQ-Orbitrap-XL (Thermo-Fisher Scientific) in negative polarity mode. Samples were analyzed by top-5 data-dependent HILIC-MS.
Proteomic Analysis
An internal standard of 100 fmol peptide retention time calibration mixture (88321, Pierce) was added to all samples prior to LC-MS analysis. Randomized and blinded samples were analyzed using top-20 data-dependent acquisition reversed phase LC-MS acquired using a Q-Exactive HF mass spectrometer (Thermo-Fisher Scientific). We used a 150 μm × 10 cm C18 reverse phase 1.7 μm BEH analytical column and a 180 μm × 2 cm 5 μm C18 trapping column from Waters technology with a 120 min method with a gradient from 2 to 98% acetonitrile in 97min, using mobile phase A 99% water 1% acetonitrile 0.1% formic acid and mobile phase B 99% acetonitrile 1% water 0.1% formic acid.
Data Analysis
As shown in supplemental Table S2, LC-MS data were acquired in random order. The sample codes are shown in supplemental Table S3. The total ion current levels for all proteomics data files are shown in supplemental Figs. S4 and S5. All raw data files have been posted to the Pride public repository (Pride Repository number PXD008990). All protein TIC traces were in the intensity range of 2.15E9 to 6.44E09 for striatum and 2.08E9 to 6.23E9 for substantia nigra. supplemental Table S4 shows the number of proteins identified for each sample, indicating stable instrument performance over the course of the data acquisition. Two proteomics data files from striatum, Rat19 and Rat 32 were corrupted because of a computer disk error.
The data were searched against the Uniprot/Swissprot database release 2015_03, species: Rattus norvegicus (rat) using Peaks Studio version 8.0 (Bioinformatics Solutions, Inc., Waterloo, ON, Canada) with a 1% false discovery rate and at least 2 unique peptides required for protein identification using PeaksDB. For striatum, 7973 entries were searched using Peaks DB and 7000 using Peaks PTM. For substantia nigra, 7921 entries were searched using Peaks DB and 7000 using Peaks PTM. The Peaks software used a decoy fusion method to calculate false discovery rate (FDR) as published (13). A 10-ppm error tolerance for the precursor (MS1) and 0.1 Da mass error tolerance for fragment ions (MS2) were specified. A maximum of 2 missed cleavages per peptide were allowed for the database search, permitting non-tryptic cleavage at one end. Trypsin specificity was defined as cleavage after Arg and Lys, when not followed by a Pro, allowing for hydroxyl proline as a variable modification. After a regular database search, a second PTM search was performed using PeaksPTM for a larger set of variable modifications which included (deamidation N, oxidation M, phosphorylation STY, HexNAc ST, HexHexNAc ST, hydroxylation K, hydroxylation-Hex K, ubiquitination K, hydroxylation P, nitrotyrosine Y) and a fixed carbamidomethylation modification. The results were a combination of database and variable PTM searches. The PEAKS Studio Quantification module was set for label free peptide quantification: significance ≥15, fold change ≥1, quality ≥0, average area ≥1E4, charges from 1–10, detected in at least 1 of 12 samples. The Peaks Studio scoring statistics are shown in supplemental Fig. S6. Protein quantification was set to: significance ≥15, fold change ≥2, at least 1 unique peptide. Abundances were normalized relative to rat young 1. Tables showing the normalization factors and Peaks exports showing peptide and protein identifications are provided as supplemental files.
Functional Annotation of Proteomes
The differentially quantified proteins from the Peaks output were functionally annotated using the Software Tool for Researching Annotations of Proteins (STRAP) software (14). Here gene-ontology analysis of the protein ID were represented with GO-term association data in pie charts (biological process, cellular component, and molecular function) as shown in supplemental Fig. S7 and supplemental Fig. S8.
Data Analysis for N-Glycan Glycomics
Glycomics mass spectral data were analyzed using GlyReSoft version 0.3.1 (available at www.bumc.bu.edu/cbms) (15–17). After deconvolution and peak picking, glycan compositions were assigned based on a combinatorial database built using HexNAc 2–9, Hex 3–10, Fuc 0–5, NeuAc 0–4 and NeuGc 0–4 constrained by HexNAc>Fuc and HexNAc-1>NeuAc. Glycan matches containing NeuGc were excluded based on strong evidence that this residue is rare in vertebrate brain (18). Note that the addition of an oxygen atom to form NeuGc is the same mass shift as a change from Fuc to Hex. Thus, the exclusion of NeuGc favored assignment of compositions of the same mass with one less Fuc and one more Hex residue. The resulting search space consisted of 5097 glycan compositions with 1 added for the internal standard tagged glycan. The program was set to allow up to 3 formate adducts, and the abundances of all adducted forms of a given composition were summed. The program extracted peak masses and volumes in the MS1 dimension. Compositions observed in at least two of the three technical replicates were assigned based on mass values. All values were normalized against the A2F internal standard. Average relative abundances in young versus aged animals were plotted as bar graphs for comparison and statistically significant differences were calculated using a two-tailed student t test. The sparsity ratio (ratio of number of values observed for each animal over the total of six per group) of each composition observed in the young or aged group was calculated and values above 0.5 considered acceptable. The number of terminal galactose was estimated by subtracting the chitobiose core (HexNAc2Hex3) and all capped lactosamine units (Neu5AcHexHexNAc) from the glycan composition. The number of lactosamine units (HexHexNAc) remaining gives the maximum number of terminal galactose residues in the glycan. Excess HexNAc such as may arise from bisecting HexNAc or Hex from a Gal-Gal motif are ignored.
RESULTS
Age-related Changes in Striatum Heparan Sulfate
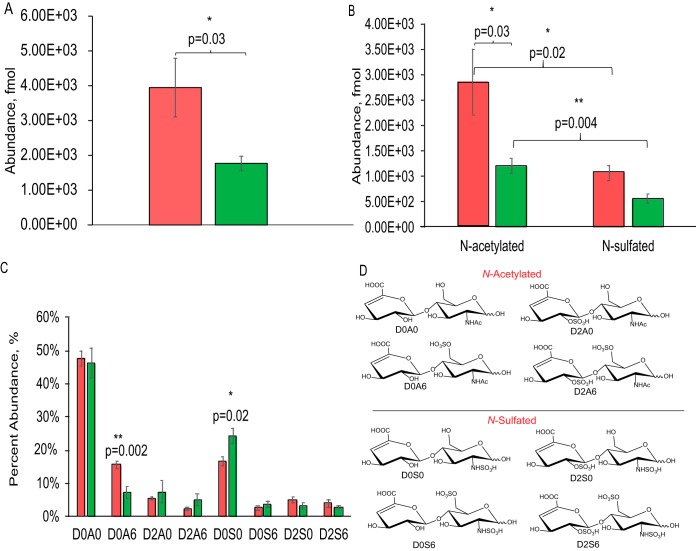
As shown in Fig. 1A, we observed that the summed abundances of HS disaccharides were higher in young compared with aged striatum. N-Acetylated disaccharide levels were significantly lower (p = 0.03) in aged compared with young striatum (Fig. 1B). We also observed significantly lower abundances of N-sulfated disaccharides compared with N-acetylated disaccharides in both young and aged striatum (p = 0.02 and p = 0.004) (Fig. 1B). Relative abundances for N-acetylated HS disaccharide D0A6 (p = 0.002) was significantly higher and N-sulfated disaccharide D0S0 (p = 0.02) significantly lower for young compared with aged rat striatum (Fig. 1C). Absolute fmol abundances of disaccharides are shown in supplemental Fig. S9A. These trends are consistent with differing HS domain structure resulting from biosynthesis and/or post-biosynthetic modification by extracellular sulfatase, heparanase and/or proteases.
Fig. 1.
Comparison of HS disaccharide abundances in young versus aged rat striatum. A, Summed abundances of all HS disaccharides; B, N-acetylated and N-sulfated disaccharides; C, relative HS disaccharide compositions. D, Key for N-acetylated and N-sulfated disaccharides structures. The error bars are given as standard error of the means, with student T-tests done for statistical significance. Data from young rats are represented in red and those from aged in green.
Age-related Changes in Substantia Nigra for Heparan Sulfate
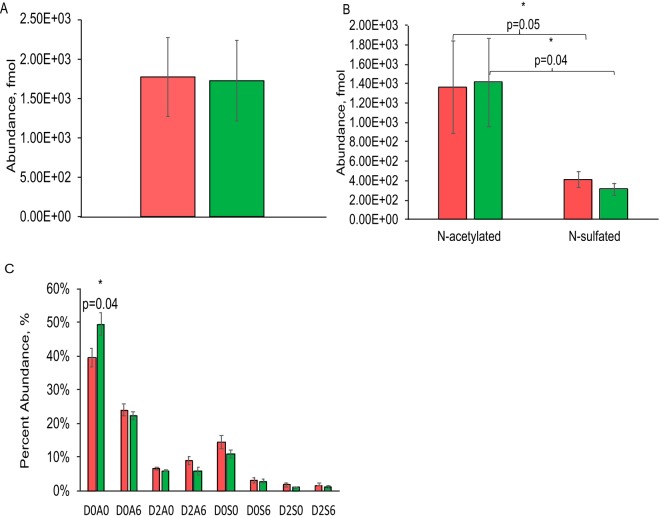
As shown in Fig. 2A summed HS disaccharide abundances did not change significantly during aging in substantia nigra. We observed lower abundances of N-sulfated compared with N-acetylated disaccharides in the substantia-nigra (p = 0.05 and p = 0.04) (Fig. 2B). The relative level of disaccharide D0A0 (p = 0.04) was significantly higher in aged compared with young substantia nigra (Fig. 2C), consistent with the conclusion that the overall HS domain structure differed significantly. Absolute fmol abundances of disaccharides are shown in supplemental Fig. S9B.
Fig. 2.
Comparison of HS disaccharide abundances in young versus aged rat substantia nigra. A, summed HS disaccharide abundances; B, N-acetylated and N-sulfated HS disaccharides; C, relative disaccharide compositions. Error bars are standard error of the means, with student T-tests done for statistical significance. Data from young rats are represented in red and aged in green. D, key for N-acetylated and N-sulfated disaccharides. Disaccharides structures are defined in Fig. 1D.
Brain-Region Specific Changes to HS Chains During Aging
Although the quantity of HS released from striatum was significantly lower for aged animals, that released from substantia nigra was similar (Fig. 3A). Both young and aged animals showed brain region specific HS disaccharide compositions (Fig. 3B and 3C). For young animals, the levels of disaccharides D0A6 and D2A6 were higher in substantia nigra and those of D0A0 and D2S0 were higher in striatum (Fig. 3B). For aged animals, D0A6 was higher in substantia nigra and D0S0 in striatum. These results show that region-specific HS chains undergo region-specific changes during brain aging. We also quantified the saturated disaccharides that derive from the non-reducing ends of the parent HS chain (supplemental Fig. S10). These disaccharides were severalfold less abundant than those of the Δ-unsaturated disaccharides produced by the action of the heparin lyase enzymes. As a result, differences in saturated disaccharides with aging were not significant. HS chain length can be estimated from the ratio of the summed Δ-unsaturated to saturated disaccharides. We observed no significant difference in chain length within experimental error.
Fig. 3.
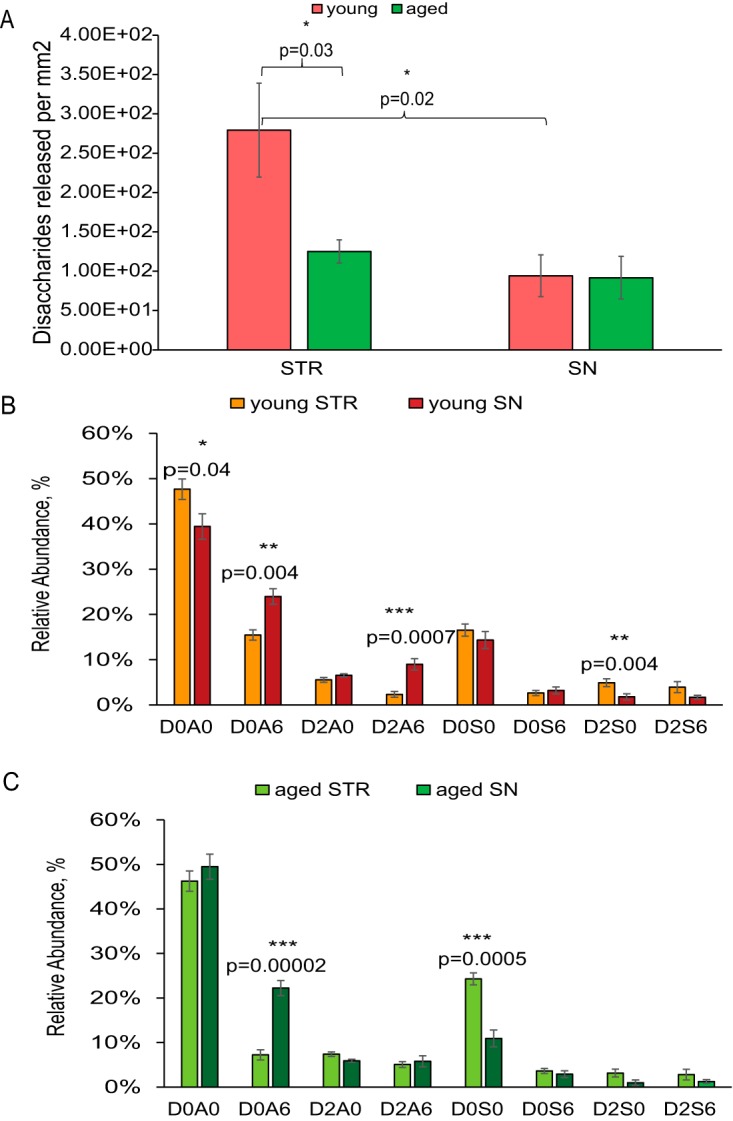
A, HS disaccharide abundance per mm2 in tissue slides from striatum and substantia nigra; B, comparison of HS disaccharide composition in young striatum and substantia nigra; C, comparison of HS disaccharide composition in aged striatum and substantia nigra. D, key for disaccharide compositions. Disaccharides structures are defined in Fig. 1D.
Age-related Changes in Striatum N-linked Glycans
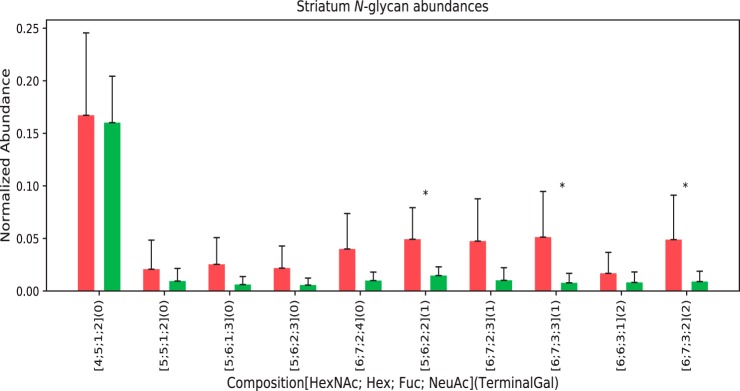
We identified a total of 35 N-glycan compositions in the set of 6 young and 6 aged striatum specimens (the raw data are included as a supplemental file). The 10 glycan compositions for which the sparsity ratio (see the Methods section) was 0.5 or above are shown in Fig. 4. The glycans are ordered on the X axis according to the maximum number of terminal galactose residues, calculated from the compositions. The three N-glycan compositions the abundances of which varied in a statistically significant manner were [5, 6, 2, 2], [6, 7, 3, 2], and [6, 7, 3, 3], given as [HexNAc, Hex, Fuc, Neu5Ac]. Although these compositions are all sialylated, each is likely to contain terminal galactose residues as estimated from the monosaccharide composition as described in the Methods section.
Fig. 4.
N-Glycans with terminal galactose from striatum. Red = young, Green = aged. The error bars show standard error of the means, with student T-tests done for statistical significance with * p < 0.05. The maximum number of terminal galactose residues was calculated as described in the methods section.
Age-related Changes in N-linked Glycans in Substantia-nigra
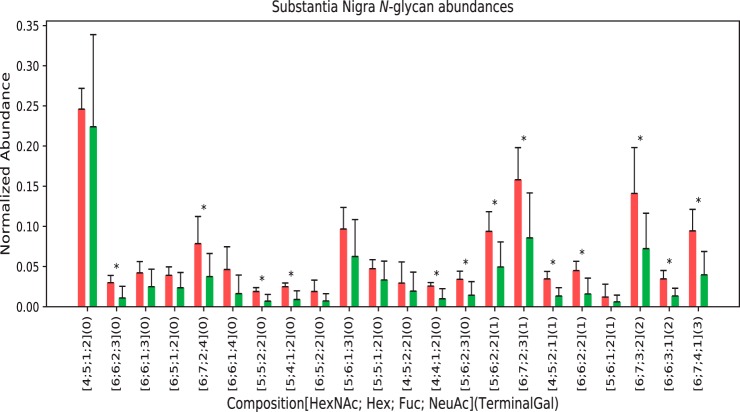
We identified a total of 46 N-glycan compositions in the 6 young and 6 old substantia-nigra specimens (the raw data are included as a supplemental file). The 22 glycan compositions observed with a sparsity ratio of 0.5 or above are shown in Fig. 5. Among these, 13 compositions varied in abundances between young and old specimens in a statistically significant manner. A subset of 7 of these compositions contained one or more terminal Gal residue using the metric described in the Methods section.
Fig. 5.
N-Glycans with terminal galactose from substantia nigra. Red = young, Green = aged. The error bars show standard error of the means, with student T-tests done for statistical significance with * p < 0.05. The maximum number of terminal galactose residues was calculated as described in the methods section.
Age-related Changes in Proteomics in the Striatum
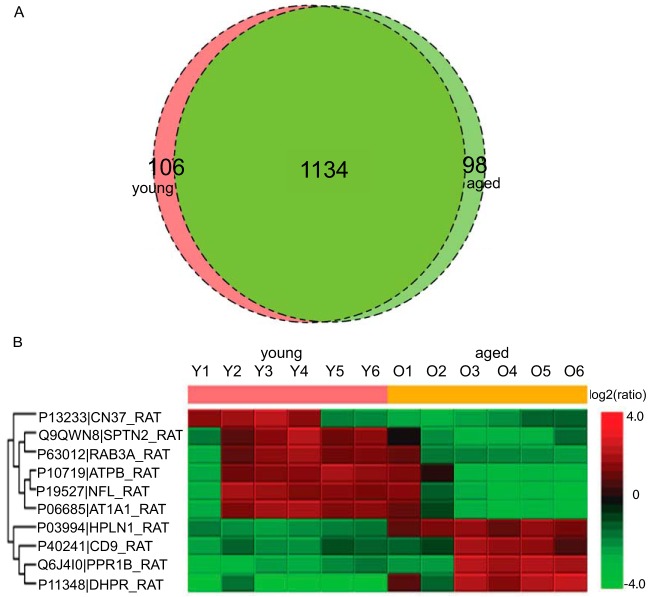
We identified an average of 1240 proteins from young and 1232 proteins from the aged striatum specimens. Fig. 6A shows the number of proteins differentially identified in young versus aged striatum and 6B the heat map of the differentially quantified proteins. Proteins including DHPR are mitochondrial or involved in mitochondrial processes. Mitochondrial dysfunction is a hallmark of aging (19). We observed Atpb, a gene responsible for the electrochemical gradient transfer across the inner membrane of the mitochondria (20), differentially quantified with age which could contribute to mitochondrial dysfunction. We also observed PPR1B, a gene responsible for dopaminergic and GABAergic signal integration (21) differentially quantified with age. Other proteins of interest included RAB3A which is involved in cell sorting. It is established that the autophagy-lysosomal pathway is affected in Parkinson's disease (22).
Fig. 6.
A, Venn diagram of proteins identified in young versus aged rat striatum with 1% FDR. B, Differentially quantified proteins by label-free proteomics.
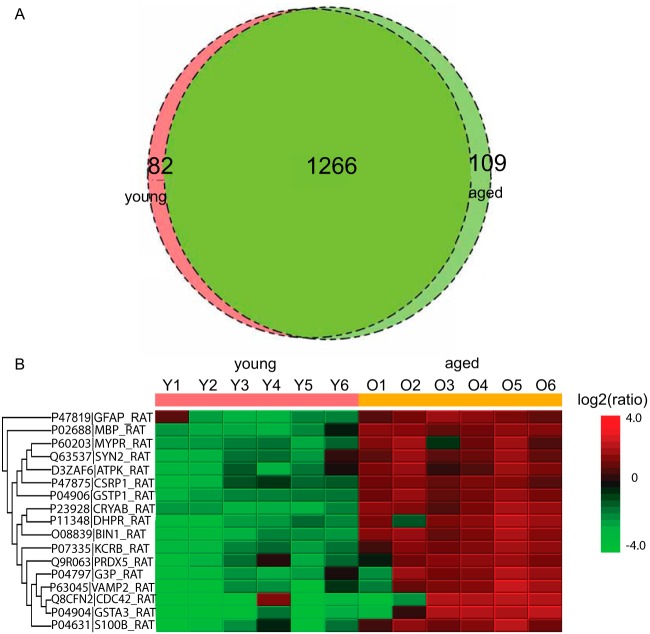
We identified an average of 1348 proteins from the young and 1375 proteins from the aged substantia nigra specimens. Fig. 7A shows the distribution of common and unique proteins identified in young versus aged substantia-nigra. The heat map for substantia-nigra protein expression is shown in Fig. 7B. Differentially quantified proteins among young versus aged substantia nigra included MBP and GFAP have been reported to change with cellular populations in aging brain (23, 24). As shown in Fig. 7B, we observed differential expression of DHPR, a protein involved in ROS. CDC42 and ATPK were differentially regulated and are involved in mitochondrial electron transport. This is consistent with alteration in the mitochondrial pathways, a known hallmark of aging and Parkinson's disease (25). We observed differential expression of proteins VAMP2 and SYN2, both of which are involved in voltage gated ion channel signaling and synapse formation (26). Also, we observed differential regulation of protein S100B, a calcium binding protein necessary for neuronal signal transduction that is known to be altered in Parkinson's disease in aged substantia nigra (27, 28).
Fig. 7.
A, Venn diagram of proteins identified from young versus aged rat substantia nigra. B, Differentially quantified proteins by label free proteomics.
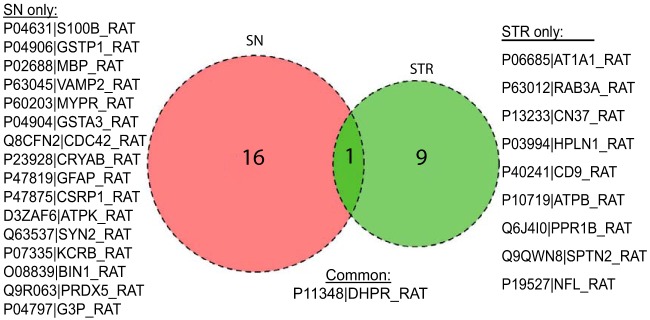
The distribution of common and unique proteins differentially quantified in the two brain regions with age is shown in Fig. 8. We observed DHPR as the only protein in common differentially quantified between striatum and substantia nigra. There are several proteins in substantia nigra in neuronal signal transduction and mitochondrial proteins like ATPK and PRDX5 that are absent in the striatum.
Fig. 8.
Venn diagram comparing differentially quantified proteins in striatum and substantia nigra.
DISCUSSION
Parkinson's disease is a candidate for gene therapy because current treatments of dopamine replacement do not slow or halt the progression of the disease (2). Gene therapy has the potential to deliver a continuous supply of neuroprotective factors to prevent further degeneration of neurons in PD patients (29–31). Currently, AAV vectors are being investigated in clinical trials to deliver trophic factors to the striatum of PD patients to provide neuroprotection for the remaining dopamine neurons (3, 30, 31). However, preclinical studies (32) demonstrate that the aged brain environment may present challenges to efficient gene transfer using rAAV2, rAAV5, and rAAV9 (8, 10). The present results suggest that brain region-specific changes in glycosylation may contribute to the reduced transduction efficiency observed in the aged striatum and substantia nigra.
We observed distinct age-related profiles of HS between striatum and substantia nigra. In the aged brain, the striatum has significantly lower overall abundance of HS whereas aging did not impact HS abundance in the substantia nigra. Although it has been reported that the receptor for AAV2 is the heavily sulfated domain that corresponds to D0S6 and D2S6 disaccharides (9, 33), we observed that in both the striatum and the substantia nigra, levels of D0S6 and D2S6 were very low and that no significant age related changes in these disaccharides were observed. However, the domain structure of HS changes in both striatum and substantia nigra during aging. Because AAV2 binds heavily sulfated HS domains, our observation of differential sulfation indicates brain region-specific HS expression is consistent with age-related changes in viral transduction. Related to this, aging studies have demonstrated alteration in levels of heparanase, an enzyme involved in degradation and restructuring of HS (34).
Desialylation increases transduction of AAV9 in Chinese hamster ovary cells, implicating binding to galactose residues exposed by removal of sialic acid residues (35). Increased binding and transduction were also observed when AAV9 was administered in the presence of sialidase in live mice (36, 37). These findings implicate galactose residues exposed by alteration of sialic acid levels in the observed changes in AAV9 binding and transduction. We observed a set of N-glycan compositions with terminal galactose that had lower abundances in aged than young brain. We observed a larger number of N-glycans with terminal galactose that varied in abundances with aging in substantia nigra than in striatum.
Our findings may reflect developmental related changes in expression of glycogenes (38) or modifications in co- and post-translation of proteins during aging (39, 40). It is observed that changes in glycosylation plays crucial roles in other age-related neurodegenerative diseases including prion (41) and Alzheimer's diseases (42). Hallmarks of aging and Parkinson's disease include protein aggregation, mitochondrial dysfunction and energy metabolism failure, oxidative stress, aberrant protein degradation, synaptic dysfunction, inflammation, blood brain barrier/ECM compromise, neurotoxicity, protein translation and lysosomal dysfunction (43). We observed age-associated changes in the abundances of several proteins involved in these pathways. Among these, we observed in the striatum a change in Atpb, a gene responsible for the electrochemical gradient transfer across the inner membrane of the mitochondria, differentially quantified with age. We also observed PPR1B, a gene responsible for dopaminergic and GABAergic receptor activation differentially quantified with age, supporting age as a risk for Parkinson's onset with aberrant dopaminergic signaling. Other proteins of interest included RAB3A which is involved in cell sorting. It is established that the autophagy-lysosomal pathway is affected in Parkinson's disease (22).
Differentially quantified proteins included GFAP, a protein known to change with cellular populations in aging brain (23, 24), and DHPR, an enzyme involved in the dopamine synthesis pathway (44). CDC42 and ATPK were differentially regulated and are involved in mitochondrial electron transport. This is consistent with alteration in the mitochondrial pathways, a known hallmark of aging and Parkinson's disease (25).
Our proteomics signatures identified CD9 as one of the proteins that changed with age in the striatum. CD9 is a co-receptor for AAV2, consistent with the conclusion that its alteration during aging is associated with reduced transduction. We also observed alterations in abundances in several proteins in neuronal signaling, with a higher proportion of changes in substantia-nigra compared with the striatum.
In summary, we observed age- and brain region specific trends in HS, N-glycans with terminal galactose, and proteomics. This work was motivated by the problem that although PD prevalence increases, AAV mediated gene transfer is reduced in aging brain. We therefore investigated age-related changes in the receptors of AAV in the nigrostriatal pathway. The primary receptor for AAV2 is HS proteoglycans. We measured the abundances of HS disaccharides released from striatum and substantia nigra, as components of the nigrostriatal pathway are affected in PD pathology. We observed in the striatum that the total level of HS disaccharides was lower in aged, compared with young, brain. We also observed brain region-specific trends in HS disaccharide abundances. The primary receptor for AAV9 is N-glycans with terminal galactose. Such N-Glycans were more abundant in young brain. The patterns of changes in levels of N-glycans with terminal galactose residues was brain region-specific. These data indicate age-associated changes in nigrostriatal glycosylation that may be of interest for identification of AAV pseudotypes with improved gene transfer efficiency in aged brain. Our proteomics results revealed differential levels of mitochondrial enzymes that may pertain to the increasing prevalence of PD with age.
DATA AVAILABILITY
Mass spectral data are available through the Pride Repository (https://www.ebi.ac.uk/pride/archive/simpleSearch?q=PXD008990&submit=Search) with Project accession number PXD008990.
Supplementary Material
Footnotes
* Funding was provided by NIH grants P41GM104603, R21CA177479, and R56AG052328.
 This article contains supplemental material.
1 The abbreviations used are:
- PD
- Parkinson disease
- HS
- heparan sulfate
- AAV
- adeno-associated virus
- EIC
- extracted ion chromatogram.
REFERENCES
- 1. Collier T. J., Kanaan N. M., and Kordower J. H. (2011) Ageing as a primary risk factor for Parkinson's disease: evidence from studies of non-human primates. Nat. Rev. Neurosci. 12, 359–366 [DOI] [PMC free article] [PubMed] [Google Scholar]
- 2. Kakkar A. K., and Dahiya N. (2015) Management of Parkinsons disease: Current and future pharmacotherapy. Eur. J. Pharmacol. 750, 74–81 [DOI] [PubMed] [Google Scholar]
- 3. Hassell J. R., Newsome D. A., Krachmer J. H., and Rodrigues M. M. (1980) Macular corneal dystrophy: failure to synthesize a mature keratan sulfate proteoglycan. Proc. Natl. Acad. Sci. U.S.A. 77, 3705–3709 [DOI] [PMC free article] [PubMed] [Google Scholar]
- 4. Kaplitt M. G., Feigin A., Tang C., Fitzsimons H. L., Mattis P., Lawlor P. A., Bland R. J., Young D., Strybing K., Eidelberg D., and During M. J. (2007) Safety and tolerability of gene therapy with an adeno-associated virus (AAV) borne GAD gene for Parkinson's disease: an open label, phase I trial. Lancet 369, 2097–2105 [DOI] [PubMed] [Google Scholar]
- 5. Eberling J. L., Kells A. P., Pivirotto P., Beyer J., Bringas J., Federoff H. J., Forsayeth J., and Bankiewicz K. S. (2009) Functional effects of AAV2-GDNF on the dopaminergic nigrostriatal pathway in parkinsonian rhesus monkeys. Hum. Gene Ther. 20, 511–518 [DOI] [PMC free article] [PubMed] [Google Scholar]
- 6. Johnston L. C., Eberling J., Pivirotto P., Hadaczek P., Federoff H. J., Forsayeth J., and Bankiewicz K. S. (2009) Clinically relevant effects of convection-enhanced delivery of AAV2-GDNF on the dopaminergic nigrostriatal pathway in aged rhesus monkeys. Hum. Gene Ther. 20, 497–510 [DOI] [PMC free article] [PubMed] [Google Scholar]
- 7. Bartus R. T., Weinberg M. S., and Samulski R. J. (2014) Parkinson's disease gene therapy: success by design meets failure by efficacy. Mol. Ther. 22, 487–497 [DOI] [PMC free article] [PubMed] [Google Scholar]
- 8. Polinski N. K., Gombash S. E., Manfredsson F. P., Lipton J. W., Kemp C. J., Cole-Strauss A., Kanaan N. M., Steece-Collier K., Kuhn N. C., Wohlgenant S. L., and Sortwell C. E. (2015) Recombinant adenoassociated virus 2/5-mediated gene transfer is reduced in the aged rat midbrain. Neurobiol. Aging 36, 1110–1120 [DOI] [PMC free article] [PubMed] [Google Scholar]
- 9. Mietzsch M., Broecker F., Reinhardt A., Seeberger P. H., and Heilbronn R. (2014) Differential adeno-associated virus serotype-specific interaction patterns with synthetic heparins and other glycans. J. Virol. 88, 2991–3003 [DOI] [PMC free article] [PubMed] [Google Scholar]
- 10. Polinski N. K., Manfredsson F. P., Benskey M. J., Fischer D. L., Kemp C. J., Steece-Collier K., Sandoval I. M., Paumier K. L., and Sortwell C. E. (2016) Impact of age and vector construct on striatal and nigral transgene expression. Mol. Ther. Methods Clin. Dev. 3, 16082. [DOI] [PMC free article] [PubMed] [Google Scholar]
- 11. Saad O. M., and Leary J. A. (2003) Compositional analysis and quantification of heparin and heparan sulfate by electrospray ionization ion trap mass spectrometry. Anal. Chem. 75, 2985–2995 [DOI] [PubMed] [Google Scholar]
- 12. Turiak L., Shao C., Meng L., Khatri K., Leymarie N., Wang Q., Pantazopoulos H., Leon D. R., and Zaia J. (2014) Workflow for combined proteomics and glycomics profiling from histological tissues. Anal. Chem. 86, 9670–9678 [DOI] [PMC free article] [PubMed] [Google Scholar]
- 13. Zhang J., Xin L., Shan B., Chen W., Xie M., Yuen D., Zhang W., Zhang Z., Lajoie G. A., and Ma B. (2012) PEAKS DB: de novo sequencing assisted database search for sensitive and accurate peptide identification. Mol. Cell. Proteomics 11, M111.010587. [DOI] [PMC free article] [PubMed] [Google Scholar]
- 14. Bhatia V. N., Perlman D. H., Costello C. E., and McComb M. E. (2009) Software Tool for Researching Annotations of Proteins: Open-Source Protein Annotation Software with Data Visualization. Anal. Chem. 81, 9819–9823 [DOI] [PMC free article] [PubMed] [Google Scholar]
- 15. Khatri K., Klein J. A., and Zaia J. (2017) Use of an informed search space maximizes confidence of site-specific assignment of glycoprotein glycosylation. Anal. Bioanal. Chem. 409, 607–618 [DOI] [PMC free article] [PubMed] [Google Scholar]
- 16. Khatri K., Klein J. A., White M. R., Grant O. C., Leymarie N., Woods R. J., Hartshorn K. L., and Zaia J. (2016) Integrated Omics and Computational Glycobiology Reveal Structural Basis for Influenza A Virus Glycan Microheterogeneity and Host Interactions. Mol. Cell. Proteomics 15, 1895–1912 [DOI] [PMC free article] [PubMed] [Google Scholar]
- 17. Maxwell E., Tan Y., Tan Y., Hu H., Benson G., Aizikov K., Conley S., Staples G. O., Slysz G. W., Smith R. D., and Zaia J. (2012) GlycReSoft: a software package for automated recognition of glycans from LC/MS data. PLoS ONE 7, e45474. [DOI] [PMC free article] [PubMed] [Google Scholar]
- 18. Davies L. R., and Varki A. (2015) Why Is N-Glycolylneuraminic Acid Rare in the Vertebrate Brain? Top. Curr. Chem. 366, 31–54 [DOI] [PMC free article] [PubMed] [Google Scholar]
- 19. Lopez-Otin C., Blasco M. A., Partridge L., Serrano M., and Kroemer G. (2013) The hallmarks of aging. Cell 153, 1194–1217 [DOI] [PMC free article] [PubMed] [Google Scholar]
- 20. Wang H., and Oster G. (1998) Energy transduction in the F1 motor of ATP synthase. Nature 396, 279–282 [DOI] [PubMed] [Google Scholar]
- 21. Fernandez E., Schiappa R., Girault J. A., and Le Novere N. (2006) DARPP-32 is a robust integrator of dopamine and glutamate signals. PLOS Comput. Biol. 2, 1619–1633 [DOI] [PMC free article] [PubMed] [Google Scholar]
- 22. Beilina A., Rudenko I. N., Kaganovich A., Civiero L., Chau H., Kalia S. K., Kalia L. V., Lobbestael E., Chia R., Ndukwe K., Ding J., Nalls M. A., International Parkinson's Disease Genomics, C., North American Brain Expression, C., Olszewski M., Hauser D. N., Kumaran R., Lozano A. M., Baekelandt V., Greene L. E., Taymans J. M., Greggio E., and Cookson M. R. (2014) Unbiased screen for interactors of leucine-rich repeat kinase 2 supports a common pathway for sporadic and familial Parkinson disease. Proc. Natl. Acad. Sci. U.S.A. 111, 2626–2631 [DOI] [PMC free article] [PubMed] [Google Scholar]
- 23. Jyothi H. J., Vidyadhara D. J., Mahadevan A., Philip M., Parmar S. K., Manohari S. G., Shankar S. K., Raju T. R., and Alladi P. A. (2015) Aging causes morphological alterations in astrocytes and microglia in human substantia nigra pars compacta. Neurobiol. Aging 36, 3321–3333 [DOI] [PubMed] [Google Scholar]
- 24. Song W., Cressatti M., Zukor H., Liberman A., Galindez C., and Schipper H. M. (2017) Parkinsonian features in aging GFAP.HMOX1 transgenic mice overexpressing human HO-1 in the astroglial compartment. Neurobiol. Aging 58, 163–179 [DOI] [PubMed] [Google Scholar]
- 25. Venkateshappa C., Harish G., Mythri R. B., Mahadevan A., Bharath M. M., and Shankar S. K. (2012) Increased oxidative damage and decreased antioxidant function in aging human substantia nigra compared to striatum: implications for Parkinson's disease. Neurochem. Res. 37, 358–369 [DOI] [PubMed] [Google Scholar]
- 26. Choi B. K., Choi M. G., Kim J. Y., Yang Y., Lai Y., Kweon D. H., Lee N. K., and Shin Y. K. (2013) Large alpha-synuclein oligomers inhibit neuronal SNARE-mediated vesicle docking. Proc. Natl. Acad. Sci. U.S.A. 110, 4087–4092 [DOI] [PMC free article] [PubMed] [Google Scholar]
- 27. Liu J., Wang H., Zhang L., Xu Y., Deng W., Zhu H., and Qin C. (2011) S100B transgenic mice develop features of Parkinson's disease. Arch. Med. Res. 42, 1–7 [DOI] [PubMed] [Google Scholar]
- 28. Sathe K., Maetzler W., Lang J. D., Mounsey R. B., Fleckenstein C., Martin H. L., Schulte C., Mustafa S., Synofzik M., Vukovic Z., Itohara S., Berg D., and Teismann P. (2012) S100B is increased in Parkinson's disease and ablation protects against MPTP-induced toxicity through the RAGE and TNF-alpha pathway. Brain 135, 3336–3347 [DOI] [PMC free article] [PubMed] [Google Scholar]
- 29. Muramatsu S. (2010) [Gene therapy for Parkinson disease]. Nihon Rinsho 68 Suppl. 8, 646–649 [PubMed] [Google Scholar]
- 30. Azzouz M., Ralph S., Wong L. F., Day D., Askham Z., Barber R. D., Mitrophanous K. A., Kingsman S. M., and Mazarakis N. D. (2004) Neuroprotection in a rat Parkinson model by GDNF gene therapy using EIAV vector. Neuroreport 15, 985–990 [DOI] [PubMed] [Google Scholar]
- 31. Bjorklund A., Kirik D., Rosenblad C., Georgievska B., Lundberg C., and Mandel R. J. (2000) Towards a neuroprotective gene therapy for Parkinson's disease: use of adenovirus, AAV and lentivirus vectors for gene transfer of GDNF to the nigrostriatal system in the rat Parkinson model. Brain Res. 886, 82–98 [DOI] [PubMed] [Google Scholar]
- 32. Bartus R. T., Kordower J. H., Johnson E. M., Brown L., Kruegel B. R., Chu Y., Baumann T. L., Lang A. E., Olanow C. W., and Herzog C. D. (2015) Post-mortem assessment of the short and long-term effects of the trophic factor neurturin in patients with α-synucleinopathies. Neurobiol. Dis. 78, 162–171 [DOI] [PubMed] [Google Scholar]
- 33. Zhang F., Aguilera J., Beaudet J. M., Xie Q., Lerch T. F., Davulcu O., Colon W., Chapman M. S., and Linhardt R. J. (2013) Characterization of interactions between heparin/glycosaminoglycan and adeno-associated virus. Biochemistry 52, 6275–6285 [DOI] [PMC free article] [PubMed] [Google Scholar]
- 34. Shevelev O. B., Rykova V. I., Fedoseeva L. A., Leberfarb E. Y., Dymshits G. M., and Kolosova N. G. (2012) Expression of Ext1, Ext2, and heparanase genes in brain of senescence-accelerated OXYS rats in early ontogenesis and during development of neurodegenerative changes. Biochemistry 77, 56–61 [DOI] [PubMed] [Google Scholar]
- 35. Shen S., Bryant K. D., Brown S. M., Randell S. H., and Asokan A. (2011) Terminal N-Linked Galactose Is the Primary Receptor for Adeno-associated Virus 9. J. Biol. Chem. 286, 13532–13540 [DOI] [PMC free article] [PubMed] [Google Scholar]
- 36. Bell C. L., Vandenberghe L. H., Bell P., Limberis M. P., Gao G. P., Van Vliet K., Agbandje-McKenna M., and Wilson J. M. (2011) The AAV9 receptor and its modification to improve in vivo lung gene transfer in mice. J. Clin. Invest. 121, 2427–2435 [DOI] [PMC free article] [PubMed] [Google Scholar]
- 37. Shen S., Bryant K. D., Sun J., Brown S. M., Troupes A., Pulicherla N., and Asokan A. (2012) Glycan binding avidity determines the systemic fate of adeno-associated virus type 9. J. Virol. 86, 10408–10417 [DOI] [PMC free article] [PubMed] [Google Scholar]
- 38. Ishii A., Ikeda T., Hitoshi S., Fujimoto I., Torii T., Sakuma K., Nakakita S., Hase S., and Ikenaka K. (2007) Developmental changes in the expression of glycogenes and the content of N-glycans in the mouse cerebral cortex. Glycobiology 17, 261–276 [DOI] [PubMed] [Google Scholar]
- 39. Brunngraber E. G., and Webster J. C. (1985) Age-related changes in the glycoproteins of brain tissue. Mol. Med. 82, 651–653 [PubMed] [Google Scholar]
- 40. Brunngraber E. G., and Webster J. C. (1986) Changes in glycoprotein carbohydrate content in the aging human brain. Neurochem. Res. 11, 579–588 [DOI] [PubMed] [Google Scholar]
- 41. Goh A. X., Li C., Sy M. S., and Wong B. S. (2007) Altered prion protein glycosylation in the aging mouse brain. J. Neurochem. 100, 841–854 [DOI] [PubMed] [Google Scholar]
- 42. Schedin-Weiss S., Winblad B., and Tjernberg L. O. (2014) The role of protein glycosylation in Alzheimer disease. FEBS J. 281, 46–62 [DOI] [PubMed] [Google Scholar]
- 43. Antony P. M., Diederich N. J., Kruger R., and Balling R. (2013) The hallmarks of Parkinson's disease. FEBS J. 280, 5981–5993 [DOI] [PubMed] [Google Scholar]
- 44. Meiser J., Weindl D., and Hiller K. (2013) Complexity of dopamine metabolism. Cell Commun. Signal. 11, 34. [DOI] [PMC free article] [PubMed] [Google Scholar]
Associated Data
This section collects any data citations, data availability statements, or supplementary materials included in this article.
Supplementary Materials
Data Availability Statement
Mass spectral data are available through the Pride Repository (https://www.ebi.ac.uk/pride/archive/simpleSearch?q=PXD008990&submit=Search) with Project accession number PXD008990.


