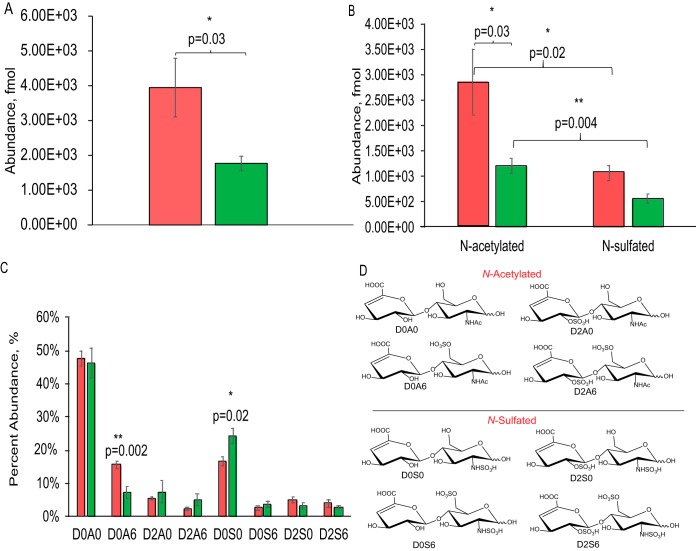
Fig. 1.
Comparison of HS disaccharide abundances in young versus aged rat striatum. A, Summed abundances of all HS disaccharides; B, N-acetylated and N-sulfated disaccharides; C, relative HS disaccharide compositions. D, Key for N-acetylated and N-sulfated disaccharides structures. The error bars are given as standard error of the means, with student T-tests done for statistical significance. Data from young rats are represented in red and those from aged in green.

