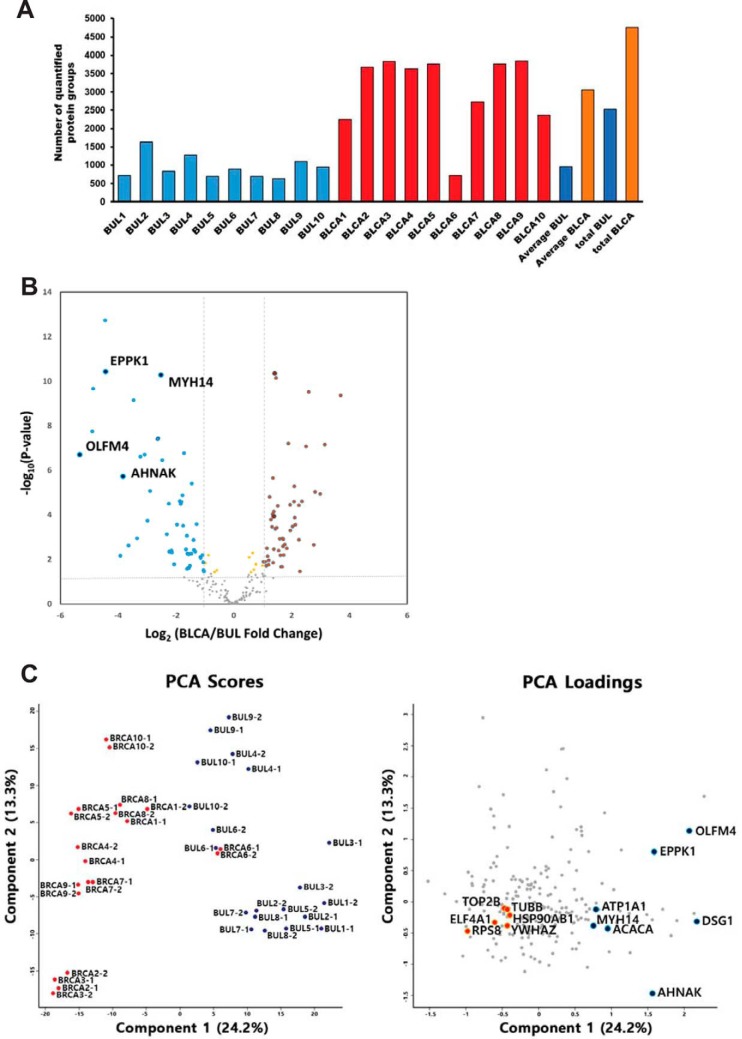
Fig. 2.
Identification and label-free quantification of non-tumor benign urothelial lesion (BUL, control) and bladder urothelial carcinoma (BLCA, case) from urine liquid-based cytology (A) results of identified proteins in benign urothelial lesion and bladder urothelial carcinoma liquid-based cytology samples. Total and average number of protein groups identified in each case. B, Volcano plot depicting the variance in expression between benign urothelial lesion and bladder urothelial carcinoma samples. Highlighted data points indicate the four proteins selected using cross-platform based analysis (blue dots, decreased intensity in bladder urothelial carcinoma; red dots, increased intensity in bladder urothelial carcinoma). Dotted vertical lines indicate one standard deviation from the mean fold-change. C, Principal component analysis (PCA) of proteome data from 20 samples using the total set of proteins quantified with an expression value across all samples (left panel). Highlighted data points indicate the 13 proteins selected using cross-platform based analysis (blue dots, decreased intensity in bladder urothelial carcinoma; red dots, increased intensity in bladder urothelial carcinoma, right panel).

