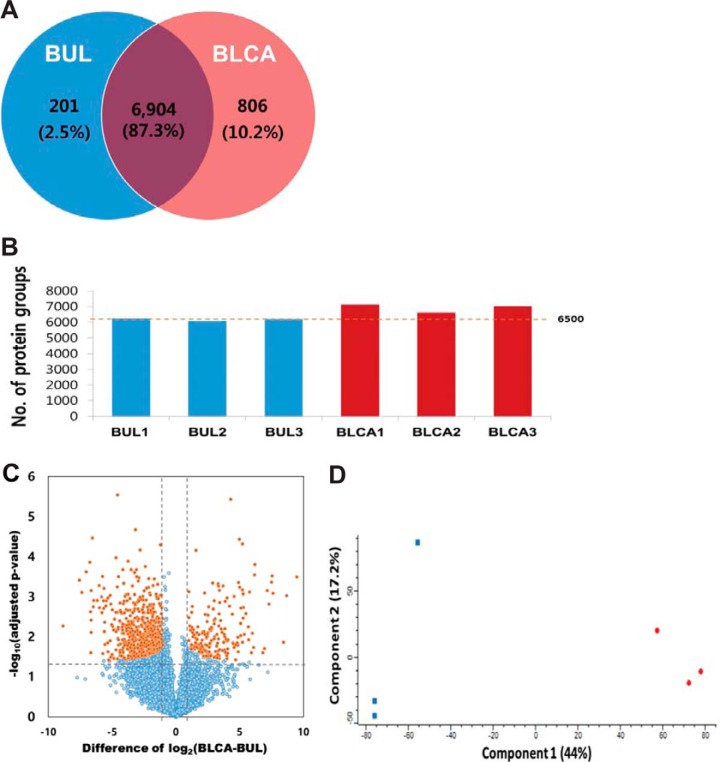
Fig. 3.
Results of proteomics analysis in BUL (cystitis cystica) and BLCA (bladder urothelial carcinoma) FFPE samples. A, Number of proteins common to BUL and bladder urothelial carcinoma. B, Number of identified proteins in individual samples. C, Volcano plot depicting the variance in expression between bladder urothelial carcinoma and BUL samples. (Orange dot: p value <0.05, Blue dot: p value ≥ 0.05). D, Principal component analysis (PCA) of proteome data from six samples using the total set of proteins quantified with an expression value across all samples (Red dot: bladder urothelial carcinoma, Blue dot: benign urothelial lesion).

