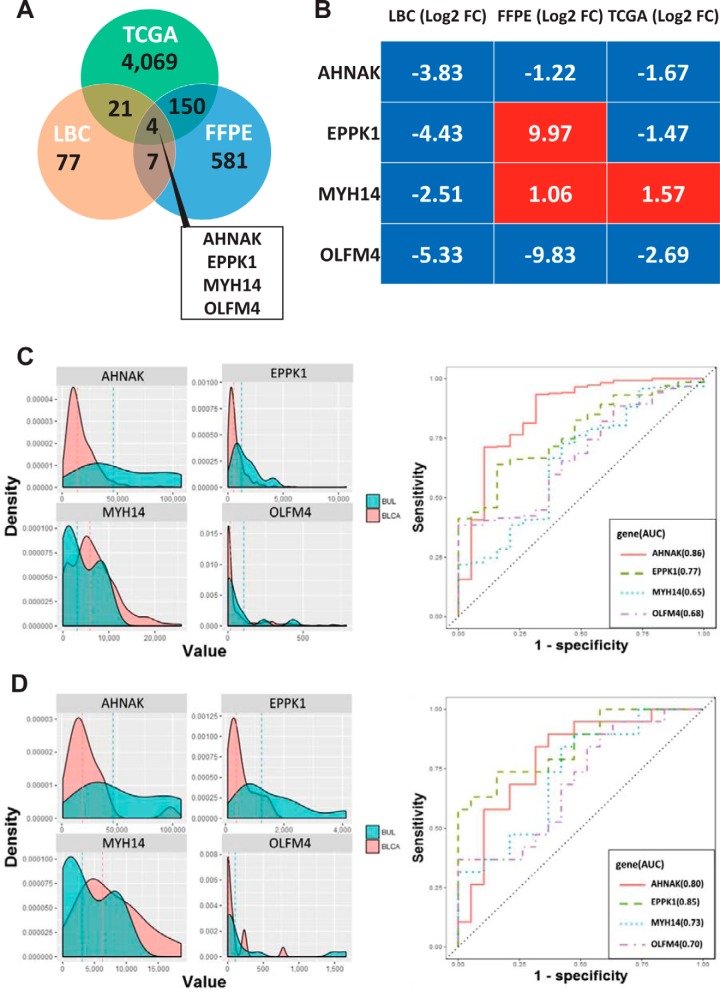
Fig. 4.
Distribution of differential mRNA (TCGA) and proteomic expression, and comparison of receiver operating characteristic (ROC) plots for the predictive power of four mRNA urinary biomarkers for distinguish bladder urothelial carcinoma (BLCA) from BUL. A, Venn diagram showing the genes differentially expressed between two proteomics and TCGA, and (B) heatmap of four common transcripts expression (Log2 fold change, FC) between benign urothelial lesion and bladder urothelial carcinoma. C, Total urothelial carcinoma cohort (n = 427) and (D) 19 paired cohort (n = 38) from TCGA. (left panel) Density distribution of correlation coefficients of mRNA expression between benign urothelial lesion (aqua) and bladder urothelial carcinoma (pink). Dashed lines indicate the mean correlation in each distribution (right panel). The area under the receiver operating characteristic (ROC) curve (AUC) of individual mRNA transcript to distinguish between benign urothelial lesion and bladder urothelial carcinoma.

