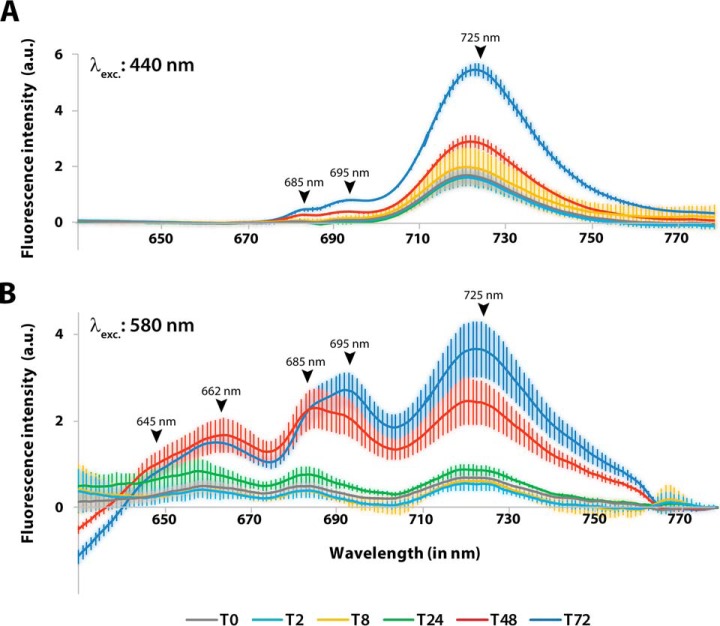
Fig. 1.
77K fluorescence spectroscopy of Synechocystis sp. cultures during the regeneration process. Fluorescence emission of samples was recorded at the indicated time points at 77K after excitation of (A) Chl a in PSI at 440 nm or (B) phycobilisomes at 580 nm. The fluorescence emission spectra shown are the average of three independent replicates, each of which was measured three times. Error bars indicate the standard error of mean. Peaks of fluorescence signals of photosynthetic pigments are indicated: phycocyanin, 645 nm; allophycocyanin, 662 nm; PSII core antennae, 685 nm and 695 nm; PSI Chl a, 725 nm.

