
Fig. 2.
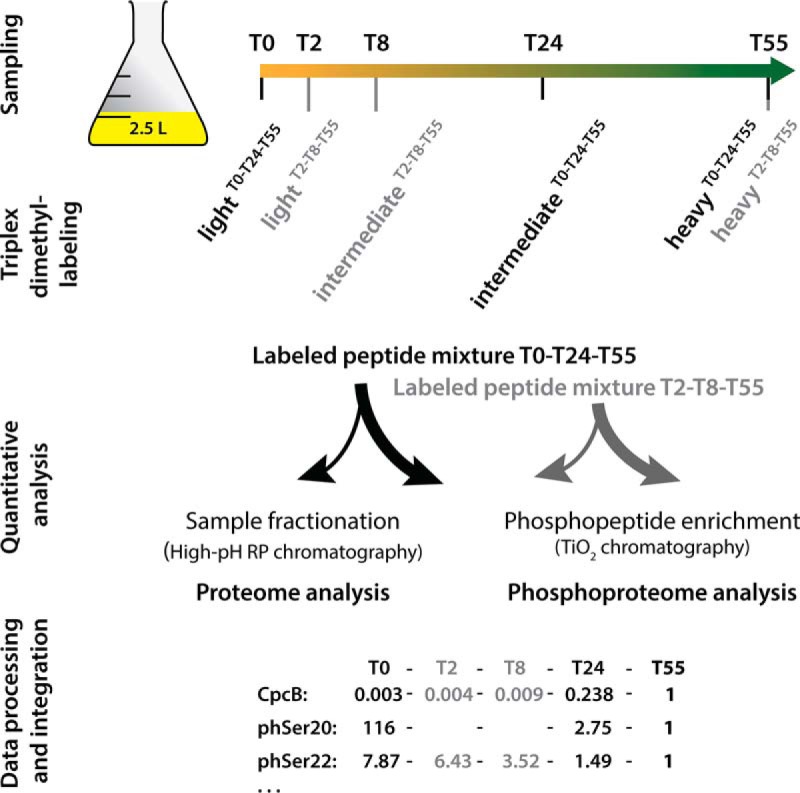
Schematic representation of the phosphoproteomic study design. All five time point samples of one replicate originate from the same culture; growth curves of replicate cultures are shown in supplemental Fig. S4. Samples from time points T0-T24-T55 (indicated in black) and T2-T8-T55 (indicated in gray) were separately triplex labeled, and the corresponding light, intermediate, and heavy dimethyl labels are indicated. Labeled peptide mixtures were combined in equal amounts per triplex mix. Peptides in an aliquot of each mixture were fractionated for consecutive proteome analysis, and the remainder was used to enrich phosphopeptides for phosphoproteome analysis. Mass spectroscopy data on relative protein and O-phosphorylation abundances relative to those of the reference point T55 were integrated into the full dataset, as indicated exemplarily for the CpcB protein and two phosphorylation events on Ser20 and Ser22.