Fig. 6.
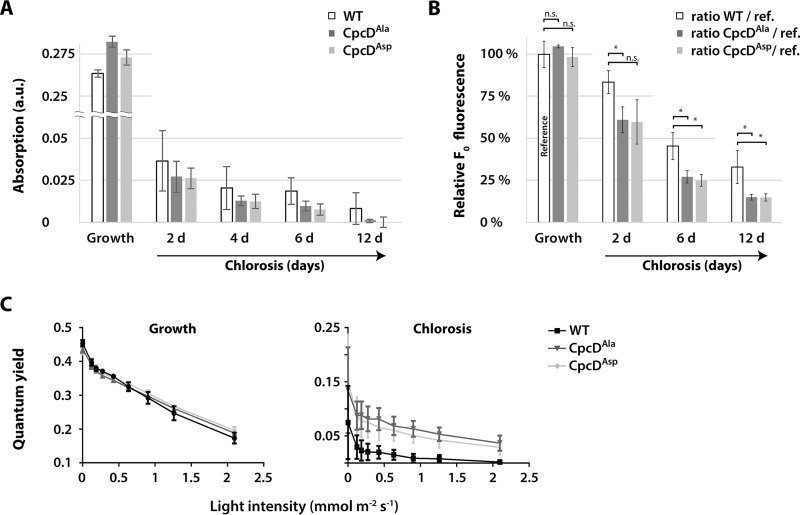
Phycobilisome turnover in CpcD mutants during chlorosis. A, Comparison of phycobilisome absorption (625 nm) in CpcDAla or CpcDAsp mutants and the wild-type during vegetative growth and during chlorosis. Shown are average values from three independent replicates at light intensities below 25 μm photons m−2 s−1 during the progression of chlorosis. Error bars indicate standard error of mean. B, Determination of minimum fluorescence (F0) ratios of CpcD mutants and the wild-type during chlorosis relative to that during vegetative growth (reference). F0 fluorescence yields were recorded during chlorosis by PAM fluorometry of three independent replicates (the same cultures as in panel A). Ratios of average values to the reference (wild-type F0 during vegetative growth; defined as 100%) are indicated. Error bars indicate standard error of mean. Significant differences (p ≤ 0.05) between the wild-type and mutants are indicated by *; n.s. indicates nonsignificant differences. C, Measurement of the PSII-phycobilisome quantum yield by PAM fluorometry at increasing light intensities during exponential growth and after 12 d of chlorosis. Error bars indicate standard error of mean, n = 3.

