
Fig. 5.
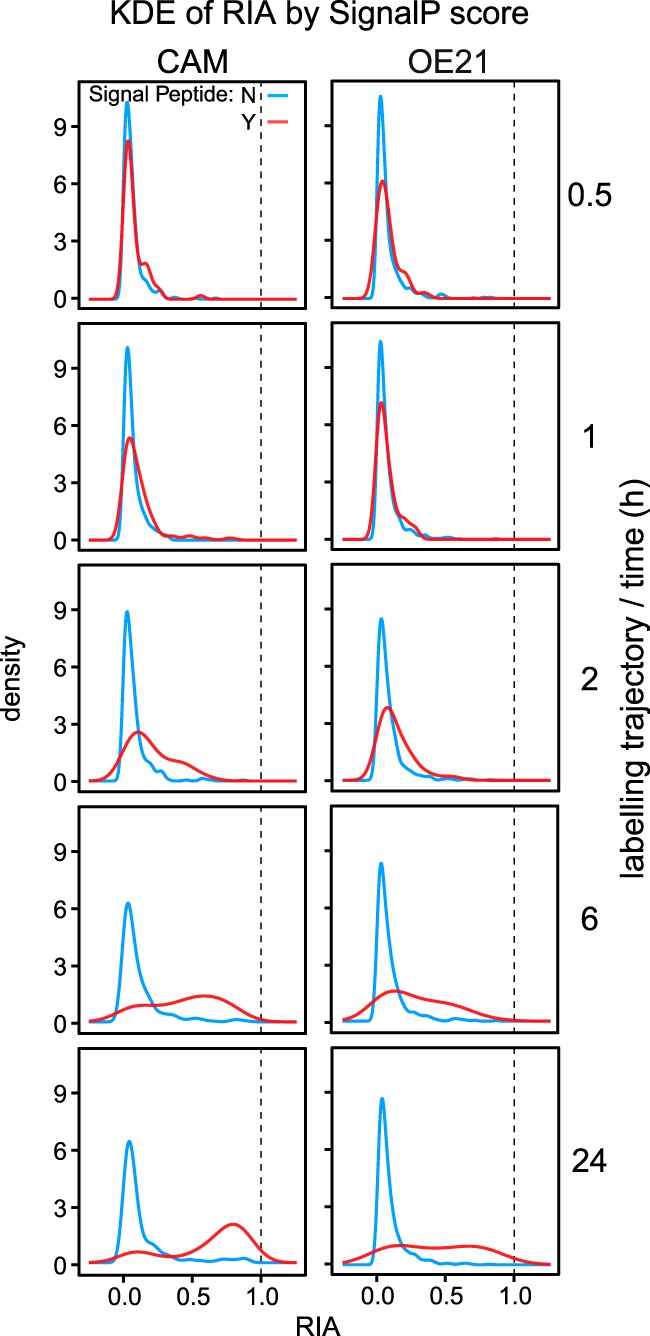
Time-dependent changes in peptide relative isotope abundance (RIA). For all high quality (13C6)lysine-labeled peptides at the indicated times, the RIA, expressed as the ratio H/(H+L) was calculated and plotted as a distribution curve using kernel density estimation. For proteins that do not contain a signal peptide (SignalP <0.5), peptides remain almost entirely unlabeled over the total trajectory of the study (blue lines). Peptides from secreted proteins (SignalP >0.5), however, demonstrate a clear transition from largely unlabeled to extensively labeled as a consequence of protein turnover/label exchange. This is especially true in the stromal CAM cell line (left hand panels), but is also evident although less pronounced in cancer (OE21) cells. The dotted lines define the maximum possible RIA that the system can attain.