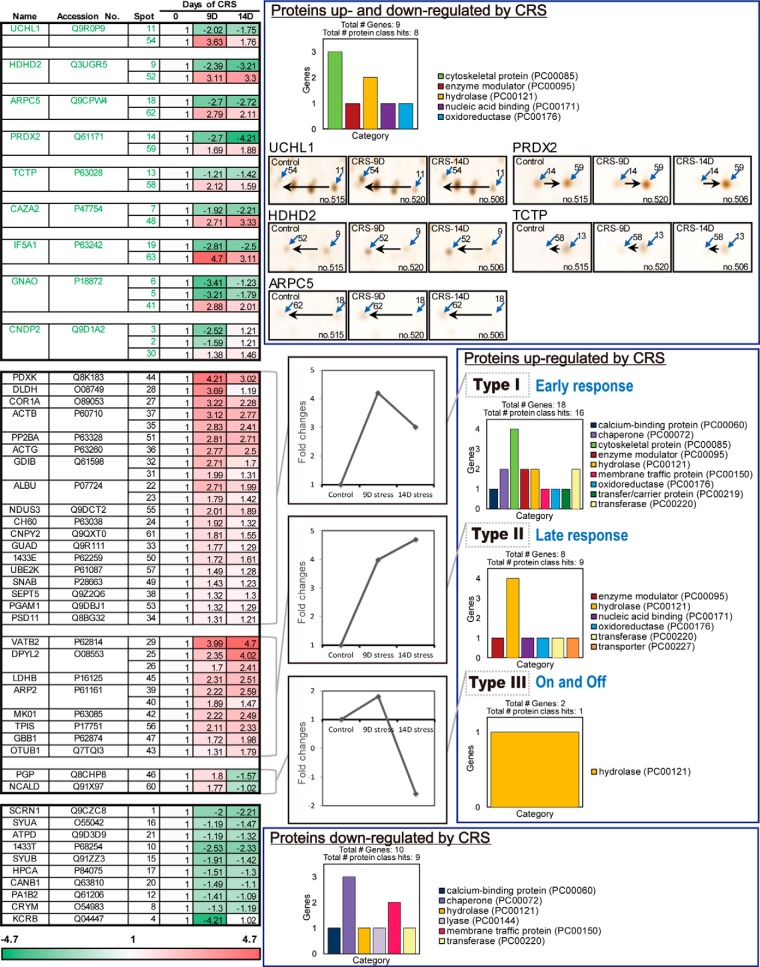
Fig. 3.
Expression kinetics patterns of CRS-regulated proteins and protein class analysis using PANTHER. Kinetics of spot intensity changes (normalized to control) by CRS were shown in the heat map. Spot intensity was measured using auto-processing 2-DE analysis software SameSpots. Proteins up- and down-regulated by CRS showed apparent spot shift induced by post-translational modifications. PANTHER protein class analysis showed that proteins up-regulated by CRS were mainly consisted of cytoskeletal protein and hydrolase. Most proteins down-regulated by CRS were chaperone and membrane traffic protein.

