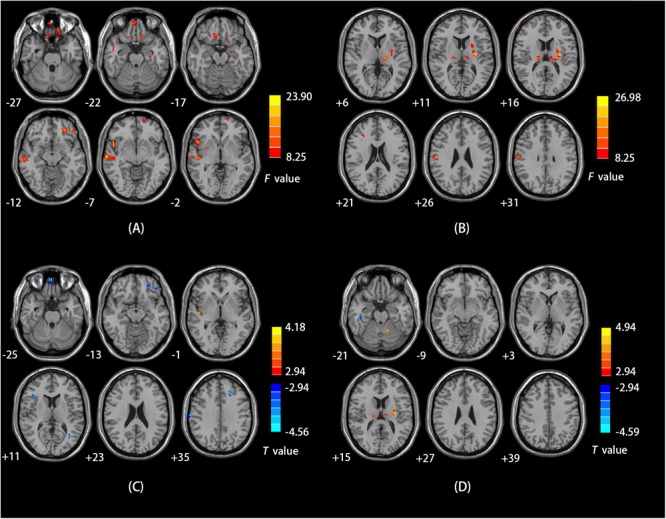
FIGURE 2.

(A) Brain regions showing sex effects on fALFF among CD patients and HCs. (B) Brain regions showing a sex-by-diagnosis interaction for fALFF differences among four groups. (C) Brain regions showing differences in fALFF between males and females with CD by sex effects. (D) Brain regions showing differences in fALFF between males and females with CD by sex-by-diagnosis interaction effects. For both C,D, Warm and cool colors, respectively, indicate brain regions with increased and decreased fALFF in male vs. female CD patients. For all panels, the effect criterion for view was uncorrected p < 0.005. The left of figure correspond to the right of brain.
