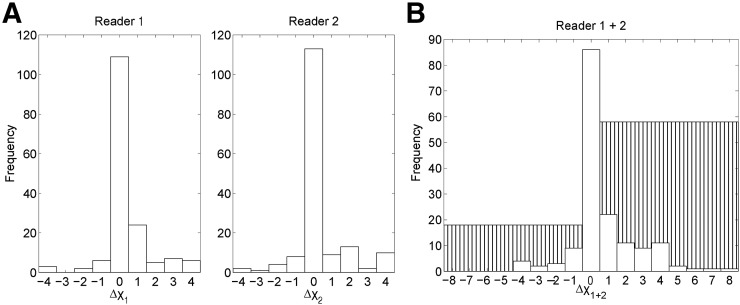
FIGURE 1.
Change in detection score χ for TP lesions between uncorrected and motion-corrected images for readers 1 and 2 separately (A) and together (B). White bars represent number of lesions with specific score changes. Hatched bars are total number of lesions with negative or positive changes in score, where a positive change is “good” (i.e., TP lesions are more detectable after motion correction).

