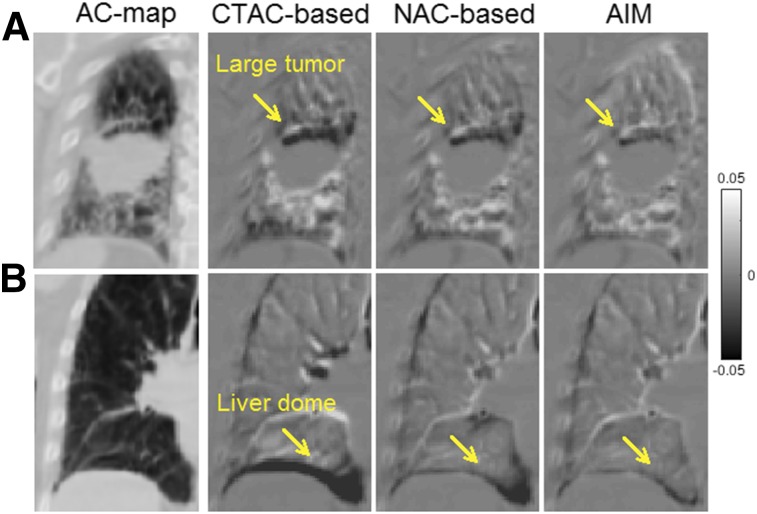
FIGURE 4.
Difference images between μ4DCT and μSyn at end-inspiration gate. Right 3 columns represent results of CTAC-based, NAC-based, and AIM methods, respectively. AC map is shown as reference. (A) Coronal slice at right-lung region with large tumor. Arrows point to top of tumor. (B) Coronal slice of right-lung region, where arrows point to liver–lung border.

