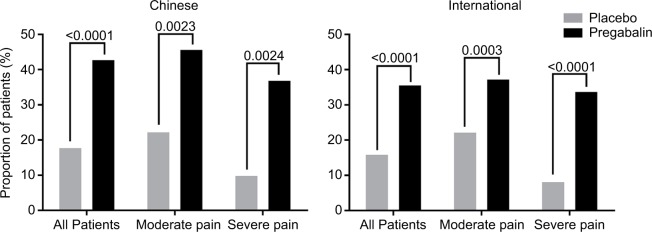
Figure 3.
Comparison of PGIC responder rates at endpoint by patient group and baseline pain severity.
Notes: Comparison of endpoint PGIC responder rates between Chinese and international patients. Comparison was made for the total patient sample in each group, and for those patients categorized as having moderate pain (mean pain score ≥4 to <7) or severe pain (mean pain score ≥7 to 10) at baseline. Patients with mild baseline pain (mean pain score <4) were excluded from the study. PGIC responders were classified as patients reporting symptoms as “much improved” or “very much improved” at endpoint. p-values for pregabalin versus placebo are as indicated.
Abbreviation: PGIC, Patient Global Impression of Change.

