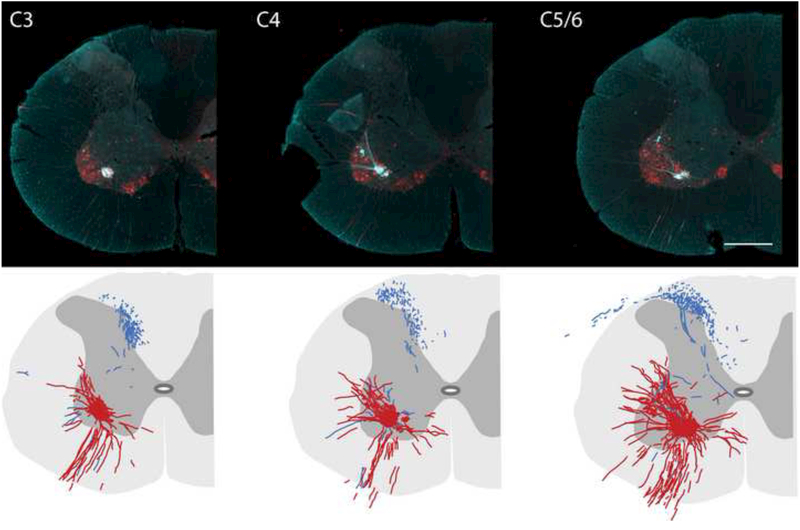
Figure 6. Representative cross sections (40 μm) of the cervical spinal cord ipsilateral to the phrenic nerve following tracing with Cascade Blue.
Representative tissue sections that were dual-labeled with Cascade Blue and ChAT are provided from the C3 (A), C4 (B) and C5/6 (C) spinal cord. The images are pseudocoloured in turquoise for optimal contrast, and reveal the distribution of Cascade Blue labeled afferents relative to motoneuron (and dendritic) labeling. Sections were selected 200 μm apart from each of these cervical regions and used to create the camera lucida images shown in Panels D-F. In these images, phrenic afferents are shown in blue (i.e., cascade blue only labeled fibers) and phrenic motoneurons are shown in red (representing dual Cascade blue / ChAT labeled cells and neurites). Scale bar is 250μm

