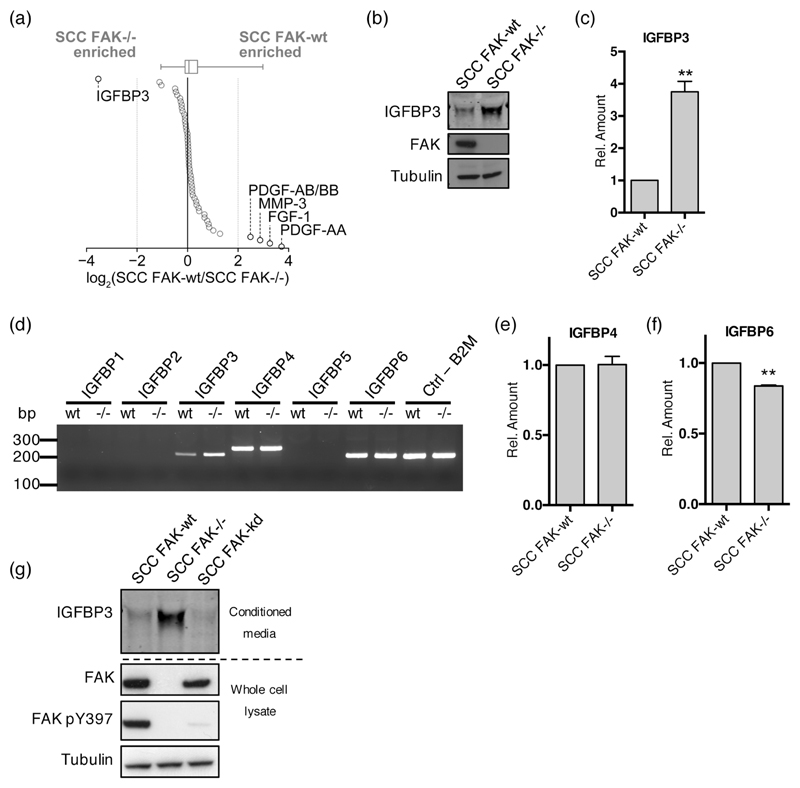
Figure 2. FAK negatively regulates the expression of IGFBP3 but not other IGFBP family members.
(a) Relative secreted levels of 53 angiogenesis-related proteins measured by antibody capture array from media conditioned by SCC FAK-wt and FAK-/- cells. Proteins are ordered by fold change. Dotted gray lines indicate four-fold enrichment; proteins changed by at least four fold are indicated. Box-and-whisker plot summarizes the median (line), 25th and 75th percentiles (box) and 5th and 95th percentiles (whiskers). (b) Representative anti-IGFBP3 western blot from concentrated conditioned media. (c) (q)RT-PCR analysis of IGFBP3 transcript levels in SCC FAK-wt and FAK-/- cells. n = 3. (d) Representative PCR analysis of IGFBP family transcript levels in SCC FAK-wt and FAK-/- cells. (e) (q)RT-PCR analysis of IGFBP4 transcript levels in SCC FAK-wt and FAK-/- cells. n = 3. (f) (q)RT-PCR analysis of IGFBP6 transcript levels in SCC FAK-wt and FAK-/- cells. n = 3. (g) Representative anti-IGFBP3 western blot showing secreted IGFBP3 protein levels from SCC FAK-wt, SCC FAK-/-, and SCC FAK-kd cells. Data in all graphs represented as mean +/- s.e.m. Unpaired T-test, **p < 0.01.

