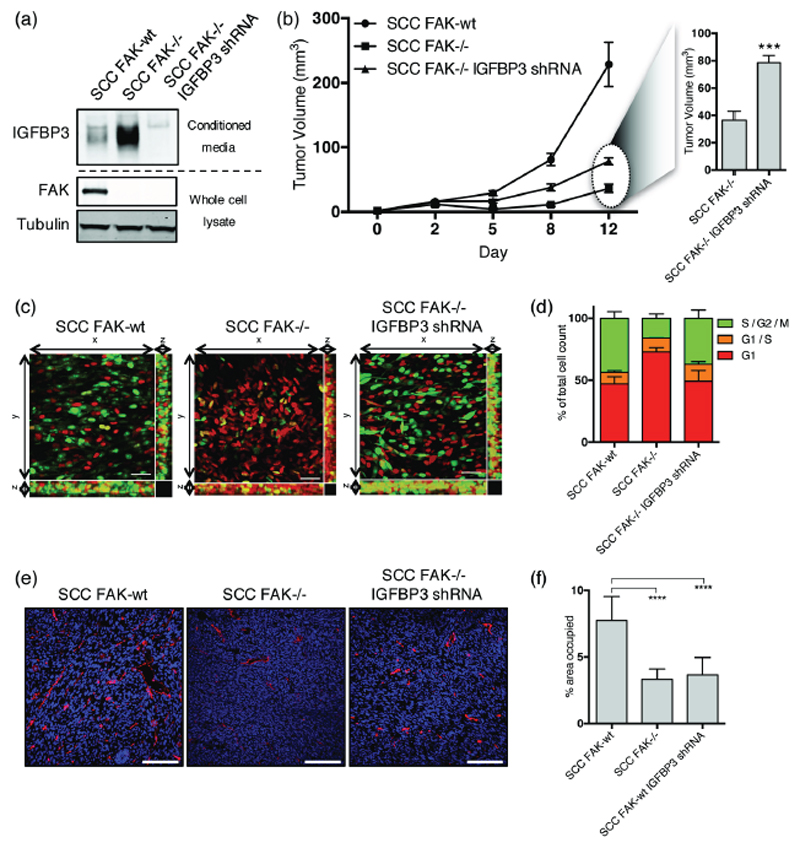
Figure 3. IGFBP3 regulates cell cycle progression but not tumor angiogenesis.
(a) Representative anti-IGFBP3 western blot from concentrated media conditioned by either SCC FAK-wt, SCC FAK-/-, or SCC FAK-/- IGFBP3 shRNA cells. Anti-FAK western blot shows FAK expression status and Anti-tubulin western blot was used a loading control. (b) Left - Growth of SCC FAK-wt, SCC FAK-/-, and SCC FAK-/- IGFBP3 shRNA tumor xenografts in CD-1 nude mice. Right – Average volume of SCC FAK-/- and SCC FAK-/- IGFBP3 shRNA tumors at day 12. Unpaired T-test, ***p < 0.001. n = 6 tumors per group. (c) Intra-vital imaging of FUCCI expressing SCC FAK-wt, SCC FAK-/-, and SCC FAK-/- IGFBP3 shRNA cells 24 hours post-implantation under dorsal skinfold windows. (d) Quantitation of FUCCI cell cycle distribution from 3-dimentional image stacks shown in panel c. Values shown for SCC FAK-wt and SCC FAK-/- cells are repeated from Fig. 1d. n = 4 tumors per group. (e) Fluorescent staining of frozen tissue sections using anti-CD31 antibody (red). Nuclei labelled using DAPI (blue). (f) Quantitation of the % area occupied by CD31+ cells. Tukey’s corrected one-way ANOVA, ****p < 0.0001. Data in all graphs represented as mean +/- s.e.m. n = 3 tumors per group with an average of 3 fields measured per tumor.

