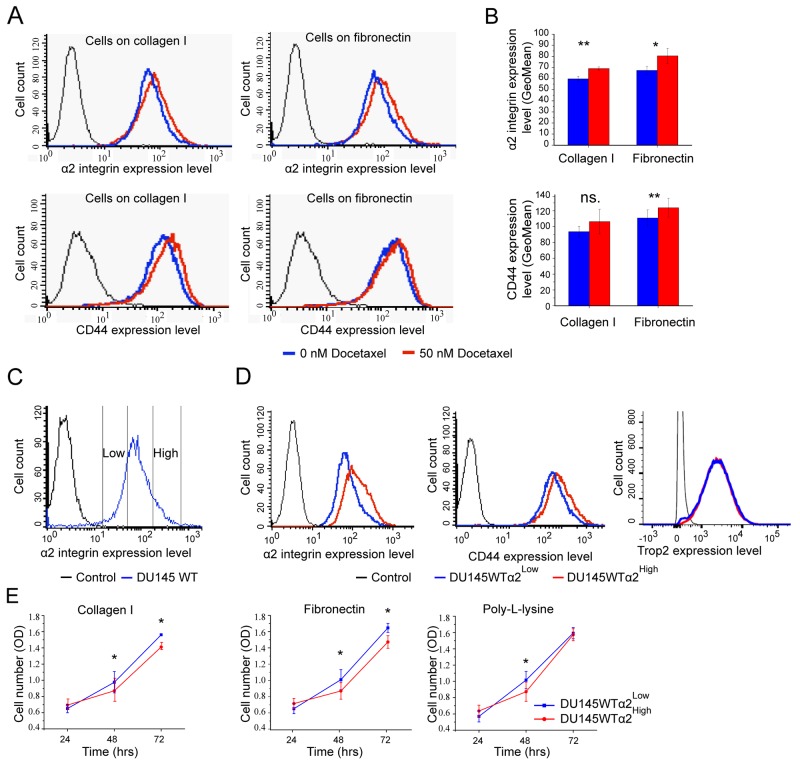
Figure 1. DU145 cells that survive docetaxel treatment show increased expression of stem cell markers: α2 integrin and CD44.
(A) The representative FACS plots show increased surface expression levels of α2 integrin and CD44 on cells that have been on collagen I or on fibronectin (5 μg/cm2) coated plates and treated with 50 nM Docetaxel for 24 hours. (B) The quantification of α2 integrin and CD44 cell surface expression based on GeoMean values. Data as mean ± SEM (n=3). * = P < 0.05; ** = P < 0.01; ns. = not significant. (C) The FACS plot illustrates the sorting of DU145WT cells into DU145WT (α2High) and DU145WT (α2Low) subpopulations based α2 integrin expression level on cells. (D) Representative FACS plots for α2 integrin, CD44 and Trop2 expression on DU145WT (α2High) and DU145WT (α2Low) subpopulations analyzed in the 5th passages after sorting. (E) Quantification of the proliferation of DU145WT (α2High) subpopulation compared to DU145WT (α2Low) subpopulation on collagen I, fibronectin and poly-l-lysine measured with the WST-8 assay. Data are mean absorbance values (OD) at 490 nm (n=3). * = P < 0.05.

