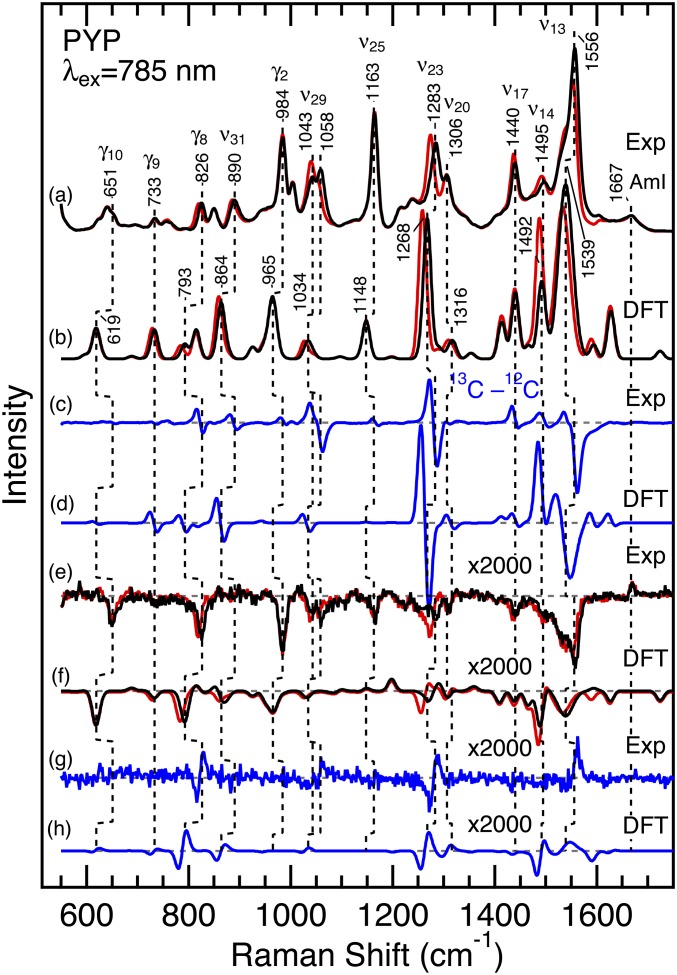
Fig. 2.
Observed and calculated Raman and ROA spectra of PYP whose chromophore is unlabeled (black) and 13C8 labeled (red). (A) The observed Raman spectra. (B) The calculated Raman spectra. (C) The observed and (D) calculated 13C minus 12C difference Raman spectra. (E) The observed ROA spectra. (F) The calculated ROA spectra. (G) The observed and (H) calculated 13C minus 12C difference ROA spectra. PYP samples were dissolved in 10 mM Tris⋅HCl, pH 7.4, and the sample concentration was 4−5 mM. The spectra were obtained with 785-nm excitation (∼200 mW). The calculated spectra were based on model 1, and Gaussian band shapes with a 10 cm−1 width were used except a 20 cm−1 width for the highest band at 1,539 cm−1. Raman and ROA intensities for the highest intensity bands were reduced by a factor of 2 (1,319, 1,314, 1,310, 1,268, 1,266, and 1,259 cm−1) or 10 (1,633, 1,628, and 1,539 cm−1) to make the other bands visible in the figure. The ROA spectra are magnified by a factor of 2,000.

